

Abstract
Background
Lily is an economically important plant, with leaves and bulbs consisting of overlapping scales, large ornamental flowers and a very large genome. Although it is recognized that flowers and bulb scales are modified leaves, very little is known about the genetic control and biochemical differentiation underlying lily organogenesis and development. Here we examined the differentially expressed genes in flower, leaf and scale of lily, using RNA-sequencing, and identified organ-specific genes, including transcription factors, genes involved in photosynthesis in leaves, carbohydrate metabolism in bulb scales and scent and color production in flowers.
Results
Over 11Gb data were obtained and 2685, 2296, and 1709 differentially expressed genes were identified in the three organs, with 581, 662 and 977 unique DEGs in F-vs-S, L-vs-S and L-vs-F comparisons. By functional enrichment analysis, genes likely to be involved in biosynthetic pathways leading to floral scent production, such as 1-deoxy-D-xylulose-5-phosphate synthase (DXS), 3-ketoacyl-CoA thiolase (KAT), hydroperoxide lyase (HPL), geranylgeranyl pyrophosphate (GGPP) 4-hydroxy-3-methylbut-2-en-1-yl diphosphate (HDS) and terpene synthase (TPS), and floral color genes, such as dihydroflavonol 4-reductase (DFR), chalcone synthase (CHS), chalcone isomerase (CHI), flavonol synthase (FLS) were identified. Distinct groups of genes that participate in starch and sucrose metabolism, such as sucrose synthase (SS), invertase (INV), sucrose phosphate synthase (SPS), starch synthase (SSS), starch branching enzyme (SBE), ADP-glucose pyrophosphorylase (AGP) andβ-amylase (BAM) and photosynthesis genes (Psa, Psb, Pet and ATP) were also identified. The expression of six floral fragrance-related DGEs showed agreement between qRT-PCR results and RPKM values, confirming the value of the data obtained by RNA-seq. We obtained the open reading frame of the terpene synthase gene from Lilium ‘Sorbonne’, designated LsTPS, which had 99.55% homology to transcript CL4520.Contig5_All. In addition, 54, 48 and 50 differently expressed transcription factor were identified by pairwise comparisons between the three organs and a regulatory network for monoterpene biosynthesis was constructed.
Conclusions
Analysis of differentially expressed genes in flower, leaf and bulb scale of lily, using second generation sequencing technology, yielded detailed information on lily metabolic differentiation in three organs. Analysis of the expression of flower scent biosynthesis genes has provided a model for the regulation of the pathway and identified a candidate gene encoding an enzyme catalyzing the final step in scent production. These digital gene expression profiles provide a valuable and informative database for the further identification and analysis of structural genes and transcription factors in different lily organs and elucidation of their function.
Electronic supplementary material
The online version of this article (10.1186/s12864-017-4303-4) contains supplementary material, which is available to authorized users.
Keywords: Gene expression, Organogenesis, Lilium, Transcriptome, RNA-seq
Background
The processes whereby an organism develops its shape and the cells and organs take on specific metabolic roles and structural characteristics are essential aspect of development and differentiation. The analysis of mutants has been a very productive approach to understand these processes and identify important regulatory elements since the last Century and several key genes that control plant organogenesis have been identified from different crops using this approach. For example, the ABC floral organ identity genes [1], LeHB-1, that participates in regulating tomato floral organogenesis [2], lic-1contributing to plant architecture [3], and ZmGSL which plays a role in early lateral root development [4]. However, the analysis of mutants is time- and labor-consuming, and particularly difficult in plants with large genomes. With the development of biotechnology, the establishment of full genome-sequences has dramatically increased our knowledge of plant genetics and molecular biology [5]. Sequencing the expressed part of the genome is nowadays achievable, even for plants such as lily with large genomes (~36Gb) [6, 7], and this can reduce the complexity and provide useful information and tools for molecular analysis [7, 8], enabling the identification of important genes.
Lilies are highly prized monocotyledonous plants (family Liliaceae, genus Lilium) with prominent bulbs, linear or oval leaves with parallel veins, and ornamental flowers. Although the taxonomy of lilies is complex, the Illumina sequencing-based digital gene expression (DGE) profiling technology, also called RNA-seq technology, has recently been applied extensively in lily research. In the past three years a large volume of data about differentially expressed genes (DEGs) involved in vernalization [9], cold-stress response [10], carbohydrate metabolism [11], dwarfism [12], pollen germination [13], flower development [14], flower color biosynthesis [15, 16] have been generated and analyzed in lily. In 2011, a few genes for developmental traits of lily were located on the genetic map, for example for flower colour (LFCc), flower spots (lfs), stem colour (LSC), antherless phenotype (lal) and flower direction (lfd) [17].
Lily bulbs consist of imbricating scales, which are modified swollen leaf bases and the large flowers have six petaloid tepals, six stamens and a superior ovary. Flowers are characterized by showy color and fragrance which are both economically important and essential for attracting pollinators in the natural environment and bulb scales are rich in starch and are important storage organs in the dormant bulb. All organs of a lily originate from the basal plate of a bulb, which makes lily morphogenesis particularly interesting. However, there have been no reports of studies on gene expression during lily organogenesis. To develop SSR markers, we analyzed a hybrid assembly transcriptome database (L.-Unigene-All) from lily (accession number: SUB2623518), based on the Illumina HiSeq 2000 sequencing platform. Taking this as a reference sequence, we carried out a digital gene expression profiling of flowers, leaves and bulb scales of Lilium oriental ‘Sorbonne’, and identified DEGs, including transcription factors and structural genes, in the three organs for the first time, providing insights into the genes participated in the differentiation of these organs, focusing mainly on candidate genes putatively participating in flower color, scent production, leaf photosynthesis and bulb development. Quantitative real-time PCR (qRT-PCR) and gene cloning were carried out for selected candidate genes involved in scent production to verify the conclusions from RNAseq data and identify genes for future analysis.
Results
Summary of gene expression profiling
Three replicates for each organ were used for cDNA library construction. For one leaf sample 74.78% of the reads matched Tulip virus X (Additional file 1: Table S1) and the data for this sample were discarded. Overall, we obtained over 11 Gb data for lily flower, leaf and scale organs. From these reads, between 73.49 and 83.12% from each sample could be mapped to the reference transcriptome. There were approximately 6 Mb perfect reads for each organ, accounting for more than 67.05% of those that were mapped to the reference transcriptome (Table 1), excluding reads with more than 2 bp mismatches. Approximately 77.71% of these sequences matched to the reference transcriptome were unique matched reads, with some multi-position reads. These data, which lay a valuable cornerstone for future work, have been submitted to the NCBI SRA database (accession number: SRP084220).
Table 1.
Summary of gene expression profiling for three lily organs
| Organ | Total reads | Total mapped Reads | Perf. match | ≤2 mismatch | Unique match | Multiposition match |
|---|---|---|---|---|---|---|
| Flower | 11,877,133 | 9,781,891 (82.36%) | 6,639,595 (67.88%) | 3,142,296 (32.12%) | 8,163,994 (83.46%) | 1,617,897 (16.54%) |
| 11,449,580 | 9,216,439 (80.50%) | 6,350,723 (68.91%) | 2,865,716 (31.09%) | 7,136,152 (77.43%) | 2,080,287 (22.57%) | |
| 11,349,225 | 8,959,443 (78.94%) | 6,040,856 (67.42%) | 2,918,587 (32.58%) | 7,444,467 (83.09%) | 1,514,976 (16.91%) | |
| Leaf | 11,481,948 | 8,894,809 (77.47%) | 5,680,563 (63.86%) | 3,214,246 (36.14%) | 6,766,819 (76.08%) | 2,127,990 (23.92%) |
| 11,708,654 | 9,732,816 (83.12%) | 6,914,703 (71.05%) | 2,818,113 (28.95%) | 6,977,857 (71.69%) | 2,754,959 (28.31%) | |
| Scales | 11,682,968 | 8,902,142 (76.20%) | 5,830,385 (65.49%) | 3,071,757 (34.51%) | 6,859,013 (77.05%) | 2,043,129 (22.95%) |
| 11,101,394 | 8,158,589 (73.49%) | 5,571,981 (68.30%) | 2,586,608 (31.70%) | 6,333,245 (77.63%) | 1,825,344 (22.37%) | |
| 10,552,892 | 8,566,038 (81.17%) | 5,440,069 (63.51%) | 3,125,969 (36.49%) | 6,448,796 (75.28%) | 2,117,242 (24.72%) |
Analysis of DEGs in each organ
Both RPKM value and false discovery rate were used for DEGs screening and original values of all transcripts are shown in Additional file 2: Table S2. Of the millions of gene sequences expressed in each biological sample, some transcripts were present in all three organs, with different expression levels but only a few thousand were significantly differentially expressed genes (DEGs) unique to a specific organ with undetectable expression in the other organs.
We obtained 2685 DEGs in the comparison of leaf-vs-flower (L-vs-F), 2296 in leaf-vs-scale (L-vs-S), and 1709 in flower-vs-scale (F-vs-S), with a false discovery rate value <0.001 [18]. From the F-vs-S comparison, there were more up-regulated genes (938) than down-regulated genes (771) in scales, taking flower as a reference organ, while with leaf as a reference organ, more genes were down-regulated in flower (1766) and scale (1534) (Fig. 1), indicating a greater number of transcripts of DEGs (65.77–66.81%) differentially expressed in leaf compared with flower and scale. There were 73 DEGs expressed in three comparisons (Additional file 3: Table S3). Thirty-six percent of these genes common had putative functions in photosynthesis and the others participated in basic processes, such as metabolism of carbohydrates, nitrogen and proteins. Two genes, CL1446.Contig13_All and Unigene6258_All, related to pathogene and defensin, were found in the three organs (Additional file 3: Table S3).
Fig. 1.
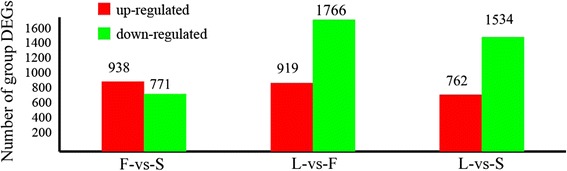
Number of differentially expressed genes in leaf (L), flower (F) and bulb scale (S)
Taking uniquely expressed genes as those with an expression value of zero in two organs while having expression value more than zero in the third organ, 474, 825 and 404 unique genes were found for flower, leaf and scale, respectively. Of these, approximately 70% have been annotated (Additional file 4: Table S4, Additional file 5: Table S5 and Additional file 6: Table S6) and there are twice the number of unique genes in leaf compared to flower and scale (Table 2).
Table 2.
Number and distribution of annotated unique organ genes
| Organ | Unique gene | Annotated | Unannotated | Annotation percent (%) |
|---|---|---|---|---|
| Flower | 474 | 324 | 150 | 68.4 |
| Leaf | 825 | 439 | 386 | 53.2 |
| Scale | 404 | 286 | 118 | 70.8 |
Gene ontology analysis of significantly DEGs
Approximately 17% of differentially expressed genes were unannotated in the database (296 in F-vs-S, 466 in L-vs-F and 393 in L-vs-S), suggesting that at least some might be new unknown transcripts, and further work will be necessary to investigate their roles. The majority (83%) of the DEGs had annotations indicating a likely function, and the numbers and functions of genes in the three pairwise comparisons were similar (Fig. 2), with 24 functional groups classified under biology process, 9 under cellular components and 12 functional groups in molecular functions. In the biological process category, most genes were characterized as having functions in categories “cellular process” (GO: 0009987), “response to stimulus” (GO: 0050896) or “regulation of biological process” (GO: 0050789), and in the cellular component subgroup, most genes were classified as related to “cell” (GO: 0005623), “organelle” (GO: 0043226) and “membrane” (GO: 0016020). Most genes in the molecular function category encoded proteins with “catalytic activity” (GO: 0003824), “binding” (GO: 0005488) and “transporter activity” (GO: 0005215) (Fig. 2).
Fig. 2.
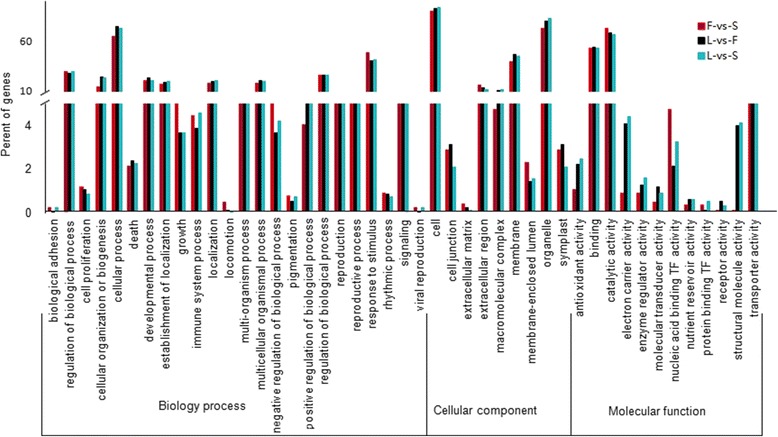
Functional categorization of genes differentially expressed in three pairwise comparisons of leaf (L), flower (F) and scale (S)
KEGG pathway analysis of significantly DEGs
KEGG (Kyoto Encyclopedia of Genes and Chromosomes) pathway enrichment analysis was used to identify DEGs significantly associated with specific metabolic pathways. A total of 1461 DEGs from the L-vs-F comparison were assigned to 117 KEGG pathways; for F-vs-S comparison, 885 DEGs had 109 pathway annotations; and in the L-vs-S comparison 1194 DEGs were related to 105 pathways. There were more DEGs with pathway annotations for L-vs-F than for the F-vs-S and L-vs-S comparisons. Genes for 95 pathways were expressed in all three organs and included housekeeping activities. More than 40% of the DEGs participated in metabolic pathways, and around 20% in the three comparisons were related to biosynthesis of secondary metabolites. In addition, more than 10% of DEGs in three pairwise organ comparisons were involved in pathways of glycerophospholipid metabolism, endocytosis and ether lipid metabolism. Figure 3 lists 46 KEGG pathways where there were more than 10 DGEs between the three pairwise comparisons. There were no DEGs in 11 KEGG pathways in the F-vs-S comparison, and these were mainly pathways involved in photosynthesis and carbohydrate and protein metabolism. For L-vs-S comparison four KEGG pathways showed no DEGs, including nitrogen metabolism, alanine/glutamate metabolism, diterpenoid biosynthesis and galactose metabolism.
Fig. 3.
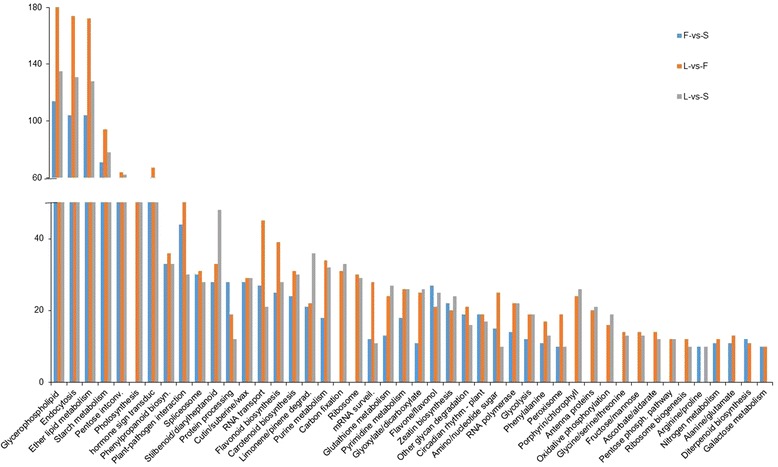
Comparison of KEGG pathways with more than 10 DEGs in three pairwise comparisons of leaf (L), flower (F) and bulb scale (S)
Mining of candidate genes related to flower color, fragrance, photosynthesis and bulb development
By GO and KEGG annotation, 20 up-regulated flower color genes were found with putative functions in flavonoid biosynthesis, including sequences homologous to DFR (dihydroflavonol 4-reductase), CHS (chalcone synthase), CHI (chalcone isomerase), FLS (Flavonol synthase), F3H (flavanone 3-hidroxylase), LAR (leucoanthocyanidin reductase), HCT (shikimate O-hydroxycinnamoyltransferase), LDOX (leucoanthocyanidin dioxygenase), TT7 (flavonoid 3′-monooxygenase) (Additional file 7: Table S7) and some of those genes, such as DFR and CHS, showed more than 10 fold higher expression level in flower compared to leaf and scale.
Monoterpenoids are the dominant classes of volatile compounds emitted from scented lilies [19–21] and genes encoding TPSs (terpene synthases) (Additional file 8: Table S8) involved in monoterpenoids biosynthesis were identified in both L-vs-F and F-vs-S comparisons. From comparisons of the predicted amino acid sequence with those of known genes from Freesia hybrid and Litsea cubeba, these were predicted to encode linalool and ocimene synthases, respectively. These TPSs were significantly up-regulated in flowers as were some other genes encoding enzymes participating in the 2-C-methyl-D-erythirtol 4-phosphate (MEP) pathway, which leads to the synthesis of monoterpenes, including DXS (1-deoxy-D-xylulose-5-phosphate), GGPP (geranylgeranyl pyrophosphate) and HDS (4-hydroxy-3-methylbut-2-en-1-yl diphosphate) (Additional file 5: Table S5). We also investigated HPL (hydroperoxide lyase) and KAT (3-ketoacyl-CoA thiolase) (Additional file 8: Table S8), which participate in the oxylipin metabolism and β-oxidation pathways, as these genes were highlighted in a recent lily floral fragrance study as being differentially expressed in lily cultivars [20]. Both HPL and KAT which were up-regulated in flower compared with scale and leaf.
Sixty-three DEGs involved in photosynthesis were identified as being up-regulated, in the transcriptome of mature leaves, related to photosystem, photosystem II, the cytochrome b6/f complex, photosystem electron transport and F-type ATPase (Additional file 9: Table S9).
Genes involved in carbohydrate metabolism, especially starch and sucrose, were of particular interest in this study because of their importance for bulb function. Twenty-one DEGs, 11 in L-vs-S and 11 in F-vs-S comparisons (with one in common for both L-vs-S and F-vs-S), were predicted to participate in metabolism of starch and sucrose (Additional file 10: Table S10). Key genes homologous to SS (sucrose synthase), INV (invertase), SPS (Sucrose phosphate synthase), SSS (starch synthase), SBE (starch branching enzyme), AGP (ADP-glucose pyrophosphorylase) and BAM (amylase) were identified. Most genes, putatively related to sucrose and starch hydrolysis, were down-regulated in scale relative to flower as reference. Different genes putatively related to sucrose or starch synthesis and hydrolysis were either up-regulated or down-regulated in scales with leaf as reference (Additional file 10: Table S10), presumably related to complicated metabolic differences in bulb at this developmental stage.
Expression patterns of genes involved in monoterpene biosynthesis
Flower scent production is of immense importance in plant biology and ecology. It plays a role in reproduction by promoting pollination through interactions with insects and other organisms, and it also contributes value to many commercially important horticultural flowers, such as Lilium cv. Sorbonne. Many scents are produce from the terpenoid pathway, as are many other biology important molecules. Therefore, we investigated genes encoding enzymes involved in monoterpene biosynthesis. In this study, five DEGs encoding four putative enzymes related to monoterpene biosynthesis were identified from the transcriptome (Additional file 8: Table S8). Genes DXS (Unigene8314_All), HDS (CL4079.Contig1_All), GGPP (CL1306.Contig1_All) and TPS1 (Unigene1934_All) showed significantly higher expression in flower than in leaf and scale (Fig. 4), whereas TPS2 showed extremely low expression in three organs.
Fig. 4.
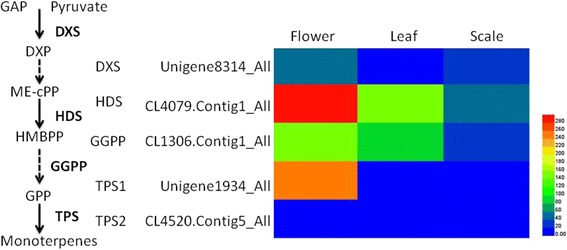
Heatmaps of DEGs related to monoterpene biosynthesis
Transcription factor analysis
Transcriptome unigenes of L.-Unigene-All were searched against the Plant Transcription Factor Database and 839 unigenes identified as transcription factors (TFs) sequences belonging to 53 putative transcription factor families, with the three largest groups being bHLH (75), MYB related (60) and C3H (55). These putative transcription factor unigenes were subjected to three pairwise comparisons which identified 54, 48 and 50 TFs differentially expressed in the F-vs-S, L-vs-F and L-vs-S comparisons (Fig. 5). The bHLH transcription factors were the largest group for F-vs-S and L-vs-F comparison and ERFs were the largest group for the L-vs-S comparison (Fig. 5). These results provide a rich resource for future analysis of the role of transcription factors in lily organogenesis.
Fig. 5.
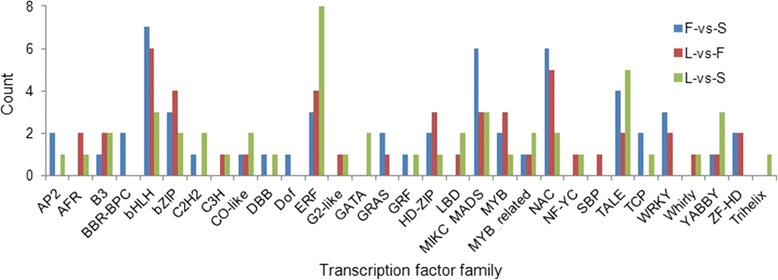
Distribution of putative transcription factors identified for three pairwise comparisons of leaf (L), flower (F) and bulb scale (S)
Construction of regulatory network of monoterpene biosynthesis
To provide a system view of the regulatory network responsible for controlling monoterpene analysis, networks were extracted based on correlation analysis between 839 putative TFs and seven putative DEGs related to flower fragrance. As a result, 31 putative TFs were identified as potentially involved in regulating the seven putative genes related to production of flower volatiles (Fig. 6a and Additional file 11: Table S11) (P < 0.01). These TFs were classified into 13 putative TF families, with the three largest TF families being the bHLH (5 Unigenes), bZIP (5 unigenes) and MYB related (4 unigenes) families (Additional file 11: Table S11). The expression profiles of these TFs potentially related to flower volatile biosynthesis were hierarchically clustered and plotted in a heatmap (Fig. 6b). Three of these (Unigene15576_All, Unigene21249_All, Unigene1921_All) with extremely high expression levels in flowers (RPKM values of 1574.3, 1514.6 and 133.1, respectively) were excluded from the heatmap, but relevant data are shown in Additional file 11: Table S11. Most of those TFs were more highly expressed in flower than in leaf and scale. The expression patterns of all 31 TFs were positively correlated with those of flower scent genes (Additional file 11: Table S11).
Fig. 6.
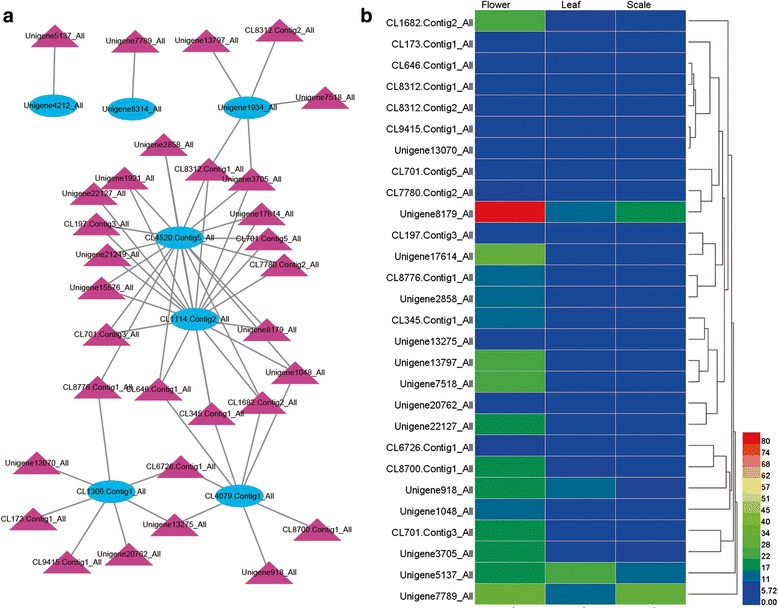
A putative regulatory network from expression profiles of monoterpene biosynthesis genes and transcription factors (TFs). a Subnetwork of putative TFs and structural genes related to flower scent volatile biosynthesis. b hierarchical clustering of expression profiles of 28 TFs related to flower scent volatile biosynthesis. Gene names are listed together with putative functions in Additional file 11: Table S11
qRT-PCR verification of DEGs identified by RNAseq
The expression profile of six flower fragrance-related DEGs from lily identified by the RNA-seq approach were tested, using quantitative RT-PCR, including key genes involved in synthesis of monoterpenoids biosynthesis: TPS, DXS, GGPP, HDS, and fatty acid derivatives and phenylpropanoid/benzenoid biosynthesis:HPL and KAT. The comparisons of expression measured by RNA-seq and qRT-PCR in the three organs were largely in agreement (Fig. 7). The expressions of these genes was highest in flowers, although some, such as HPL also had high expression in leaves.
Fig. 7.
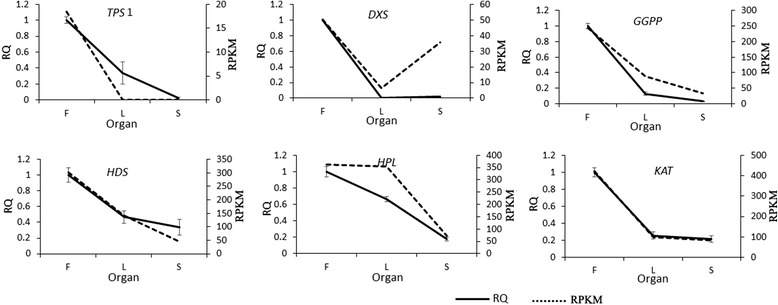
qRT-PCR validations of expression patterns of DEGs involved in flower fragrance. X-axis indicates organs, and y-axis indicates gene expression levels by qPCR (left) and RPKM (right). Solid lines in all plots indicate the relative expression value obtained by qPCR; the dotted lines indicate the RPKM values obtained by RNA-seq
Cloning of TPS genes from cDNA
Terpene synthases (TPS) are that key enzymes that catalyze the last step of the MEP pathway to produce terpenes. There are numerous terpenes and TPSs in plants and small changes in amino acid sequence generate the unique properties and diversity of these important compounds. Primers were designed based on the sequence of transcript CL4520.Contig5_All (accession number: SUB2623518), which had sequence homology with TPS genes, and attempts were made to clone the complete cDNA sequence from petal. However, these attempts failed with three different pairs of primers. When the sequence was checked against the NCBI database it was found to be a mixed clone, part of which was highly homologous (91.17% at the cDNA level) to the complete coding sequences of LhTPS from ‘Siberia’ (accession number: KF734591), together with a second unrelated open reading frame. Based on the Lilium oriental ‘Sorbonne’ sequence information, new primers were designed and a putative TPS sequence (NCBI accession: MF401556, designated LsTPS) was acquired with an open reading frame (ORF) of 1761 nucleotides, which has 99.55% sequence homology with the TPS coding sequence of transcript CL4520.Contig5_All. Phylogenetic analysis (Additional file 12: Figure S1) based on deduced amino acid sequences showed that LsTPS were highly homologous with CL4520.Contig5_All, and with the other two amino acid sequences from Lilium ‘Belladonna’ and ‘Siberia’. It was clustered with LcTPS1, which is a member of Tps-b group and was able to convert Geranyl diphosphate into trans-ocimene [22].
Discussion
Profiling of differentially expressed genes in lily organs
The aim of this study was to identify differences in the identities and expression patterns of specific genes and pathways operating in leaves, flowers and bulb scales. To our knowledge, this is the first report of the differentially expressed genes in these three major organs in lily. A large number of new genes and transcription factors involved into photosynthesis, bulb development, flower color and flower scents have been identified. As expected, RNA-seq generated a great deal of information, which will help identify targets to understand the factors controlling organ development and differentiation.
A greater number of DEGs were found in the L-vs-F and L-vs-S comparisons (2685, 2296) than in the F-vs-S group (1709), which indicated that compared to leaf, flower and scale had fewer differentially expressed genes (Fig. 1a). Each organ was also, as expected, characterized by expression of specific classes of genes. In leaves, for example these included genes involved in photosynthesis, carbon metabolism, nitrogen and protein metabolism. In contrast, 21 of the DEGs identified in scales were involved in starch and sucrose metabolism (Additional file 7: Table S7) and the importance of these pathways has previously been demonstrated at the transcriptional level in bulbous plants, such as Lilium davidii var. unicolor [11], Gladiolus hybridus [23] and Tulipa gesneriana [24].
Candidate genes related to flower color, fragrance, photosynthesis and bulb development
In this research, materials were harvested from plants at a stage when leaves were mature and flower color and scents were developing. We believe this is the best time to maximize the gene expression differences between the different organs and mine differentially expressed genes in organs of flower, leaf and scales. Flavonoids are accumulated in pink flowers of lily [25], and genes involved in the flavonoid biosynthesis pathway received special attention in this study with Lilium ‘Sorbonne’, which has pink flowers. A total of nine flower color-related genes, DFR, CHS, CHI, FLS, F3H, LAR, HCT, LDOX, TT7, were identified. Many of these belong to multi-gene families and several homologs were identified for each gene. Interestingly, a very recent de novo transcriptome sequencing of flower buds at different development phases of Lilium ‘Sorbonne’ also identified most of those genes [15], indicating the power of digital gene profiling in gene mining. All of the identified flower color genes have been cloned from different plants such as Arabidopsis and Petunia [26, 27], and an increasing number have been cloned from lily, such as LhDFRs, LhCHS [28, 29] and LhF3S [30]. DFR was identified from the pink petal of ‘Sorbonne’ in this study and LhDFRs have also been shown to be expressed in the Asiatic lily ‘Montreux’, which has pink flowers, but not in the Asiatic ‘Connecticut King’, which has yellow flowers [28].
Because oriental lily can emit complicated volatile compounds, it has been regarded as a potential model system for the elucidation of gene products responsible for the synthesis of volatiles [20]. The differential expression of monoterpene synthase genes has been suggested to be a key reason for differences in floral scent [31] and we identified a monoterpene synthase gene (TPS) predicted to code for enzymes synthesizing linalool and trans-ocimene. Three genes, LcTPS1, LcTPS2 and LcTPS3, have been cloned from Litsea cubeba [22], encoding enzymes synthesizing trans-ocimene, α-thujene and (+)-sabinene respectively, and other TPS genes, encoding myrcene synthase (LiMys) and linalool synthase (LiLis), have also been cloned from Lilium ‘Siberia’, ‘Novano’ and L. regale [31–33]. Here, we cloned LsTPS from Lilium ‘Sorbonne’ and predicted the cloned sequence of LsTPS might encode enzymes synthesizing trans-ocimene by phylogenetic analysis (Additional file 8: Figure S1). Some other genes encoding enzymes involved in production of the terpenoid backbone in the MEP (2- C -methyl- D -erythritol 4-phosphate) pathway, DXS, GGPP and HDS, were also identified. DXS is a pivotal gene in the first step of MEP pathway and has been extensively studied in tomato, Arabidopsis and grape [34–36], and had been identified and cloned in lily by Johnson et al. [20]. However, functional analysis of these genes is still needed to confirm their role in lily flower scent production and a comparison of expression in scented lilies and those without fragrance [31] should also prove informative.
Unsurprisingly, DEGs participating in photosynthesis were identified as being up-regulated in leaves. Previously, homologous sequences of psbA and atp has been cloned in a study analyzing the complete plastid genomes of L. nobilissimum and L. longiflorum [37] and psbA-homologous proteins has been isolated from L. superbum [38], and this study has greatly increased the number of gene sequences identified in Lilium.
There have been several studies on the variation of carbohydrate compounds during bulblet development [39, 40]. Li et al. [11] revealed the variation in starch and sucrose content at different stages of bulblet initiation and enlargement in Lilium davidii var. unicolor. However, little is known about changes at the molecular level, especially between underground and above-ground stages. Kawagishi and Miura [41] divided the period of a lily development into four stages, and in this study we used the third stage, corresponding to flower bud expansion to flowering, when both above-ground and underground organs show a vigorous increase in dry weight, and bulbs can be both source and sink [42], underlying the complexities of metabolic activity in bulb scales. We found that putative sucrose- and starch-hydrolysis genes, such as SS, INV and BAM were down-regulated in scales compared to flowers as reference, and sucrose and starch synthesis genes, such as SPS and SSS were down-regulated also in scale with leaf as reference, which is consistent with the lack of rapid swelling and bulb growth for plants with 5.5 cm buds used in this study.
Identification of transcription factors and regulatory network
The largest families of transacting transcription factors modulate plant development [11, 43]. In this study, 839 unigenes were identified as TFs, and 31 of them were identified as potentially involved in regulating production of flower volatiles. Although terpenoid metabolism is very important in biochemical differentiation and tissue function in plants, not many TFs are known to be involved in the regulation of the pathway. In Solanum lycopersicum, bHLH and WRKY were identified activating terpene synthase promoters, with MYC synergistically transactivating the SlTPS5 promoter [44]. and activated distinct terpeniod biosynthesis in Catharanthus roseus and Medicago truncatula [45]. Ethylene-related TFs have also been implicated in regulating TPSs, for example in Artemisia annua, AaERF1 and AaERF2 positively regulate artemisinin production [46] and in Newhall sweet orange CitAP2.10 activates the CsTPS1 that produces valencene [47]. Based on this comparative information, bHLH, WRKY, ERF/AP2 family members would seem likely candidates for regulating lily flower TPS and studies on other pathways indicate that a complex network may be involved.
In this study, bHLH was the largest TF families in F-vs-S and L-vs-F comparison and in the putative flower volatile biosynthesis network (Fig. 5, Additional file 11: Table S11). CL4520.Contig5_All, a putative TPS gene (Additional file 12: Figure S1), were regulated by 17 TFs (Fig. 6a). Four of these were bHLH (Additional file 11: Table S11). However, flower volatile regulation is clearly complex (Fig. 6a), and many TFs, including bHLHs, probably regulate multiple structural genes synchronously during flower development, in concert with other TFs in the network. Candidate TFs have been identified in this study and their role can now be tested. Furthermore, the complete TF database identified from this study has additional potential for improving our understanding of the differential regulation of gene expression during development of leaves, bulbs and flowers.
Verification of the database
Although high-through sequencing technology has become a powerful tool to identify candidate genes and investigate gene expression patterns [48], further validation is needed, especially for non-model organisms without reference sequences, and for plants with huge genomes. Although in most cases, there was a good correlation between transcript abundance assayed by qRT-PCR and the transcription profile revealed by DGE profiling [11, 16, 49], there have also been reports of inconsistencies between the two methods [50, 51]. In this study, a general agreement was obtained by the two different methods. All verified genes except HPL had higher expression level in flower than in leaf and scale. A very recent study revealed HPL involvement in protecting the photosynthetic apparatus [52]. We deduce that this gene may play an important role in lily leaf and further functional studies are required to understand its role in lily leaf and flower. A putative error in the assembly of CL4520.Contig5_All was identified during subsequent attempts to clone the cDNA sequence although this did not effect the open reading frame of LsTPS and the complete sequence was subsequently obtained. To our knowledge, this is the first report of TPS gene from Lilium ‘Sorbonne’ and it is proposed that this is important for our understanding of scent production in this species. Overall, the extensive RNA-seq data provides a platform for candidate gene identification in lily organs and elucidation of their function.
Conclusions
In the present study, DEGs related to lily flower color, flower fragrance, photosynthesis and bulb development were identified by RNA-seq technology. Approximately 11 Mb data were generated for each lily organ, a few thousand DEGs were identified in the comparisons, and hundreds of genes specific for each of the three organs identified. By functional enrichment analysis, genes for floral scent (TPS, DXS, KAT, HPL et al.), floral color (DFR, CHS, CHI and FLS et al.), starch and sucrose metabolism (SPS, SS, INV, SSS, SBE, AGP and BAM) and photosynthesis (Psa, Psb, Pet and ATP) were identified. The expression of six floral fragrance-related DGEs showed a similar expression pattern between qRT-PCR results and RPKM values, confirming the value of the data obtained by RNAseq. LsTPS was cloned based on the sequence of transcript CL4520.Contig5_All with an ORF of 1761 nucleotides. The lily DGEs identified in this research include transcription factors, flower-specific genes with putative functions in flower color and scent biosynthesis, photosynthesis-related genes in leaf, and starch and sucrose metabolism-related genes in scales, and provide a valuable and informative database for understanding lily organogenesis, mining of important genes, and research into gene function. Based on these results a putative regulatory network for monoterpene biosynthesis is proposed.
Methods
Plant materials and RNA extraction
Lilium oriental hybrid ‘Sorbonne’ bulbs were planted in the field of the Institute of Landscape Architecture, Zhejiang University (ZJU), China in October, 2013 and they sprouted in March 30th, 2014. Three whole plants were harvested on a sunny day of June 13th at 9 am, 2014 (temperature 24 °C; 41,889.3 Lux) when leaves were mature and flower color and scent were developing and brought to the lab immediately. 5.5 cm flower buds (named F), leaves from the centre of the stem (named L) and inner bulb scales (named S) were collected from each of the three plants. Three biological replicates were used for each organ. Samples were placed in 50 ml tubes and stored at −80 °C until use. The RNA isolation method was as described in Du et al. [53]. A total of nine RNA samples were isolated using a modified CTAB method [54] (three replicates for three organs) respectively. The quality and concentration of RNA were checked using an Angilent 2100. RNA with (RIN) ≥ 7, 28S:18S > 1, OD260/280 ≥ 2, and OD260/230 ≥ 2 were used for sequencing.
Construction of DGE database
Nine cDNA libraries were constructed respectively based on 9 samples from three replicates of three organs. Details for the construction was as described in Feng et al. [55]. RNA library processing and sequencing via Illumina HiSeqTM 2000 were carried out by staff of the Beijing Genome Institute (BGI) (Shenzhen, China). Clean reads were obtained by data filtering to remove reads with adaptor sequences, more than 10% unknown bases, and those with low quality bases above 50%. The clean reads were mapped to reference sequences of L.-Unigene-All (accession number: SUB2623518), a hybrid assembly comprehensive transcriptome acquired by our lab, using SOAP aligner/SOAP2 [56], and short sequences less than 200 were discarded. The parameters for SOAP aligner/SOAP2 were as follows: option = −m 0 -× 500 -s 40 -l 35 -v 5 -r 2. No more than two mismatches were allowed in the alignments. Once reads passed sequencing saturation and randomness assessment, a digital gene profiling database for each sample was set up.
Quantification of gene expression
The gene expression level was calculated by using RPKM (Reads per kb per million reads) which eliminates the influence of different sequence lengths and discrepancies due to sequencing depth. The differences in gene expression between samples can be compared directly by comparing RPKM values.
Screening of differentially expressed genes between two groups
The NOlseq method [57] was used to screen for differentially expressed genes between two groups. Two main steps were conducted: first, the noise distribution was calculated and then DEGs were divided into groups. The expression values for each gene in each group were used to calculate log2 (fold-change) M and the absolute difference value D of all pair conditions (gene expression value was scored as 0.001 for genes not expressed in a sample). For each gene, an average expression value across replicates was used to calculate M and D. Then, all these M/D values were pooled together to estimate the noise distribution. In the case where gene i is differentially expressed between two groups, Gi was set as one, otherwise as 0. This gave the P value, the probability of gene i being differentially expressed. Formulae for M, D, P calculation are as follows:
In this paper, genes with P greater than 0.8 and M greater than 2 were considered to be differentially expressed between groups.
Functional analysis of differentially expressed genes
All Unigene sequences were aligned to the protein databases NCBI non-redundant (NR), the Swiss-Prot protein database (Swiss-Prot, in UniProt), the Kyoto Encyclopedia of Genes and Genomes (KEGG, www.genome.jp/kegg/) and the Clusters of Orthologous Groups of proteins (COG, http://www.ncbi.nlm.nih.gov/COG/) (E value <10−5) by BLASTx. To identify the main biological functions associated with the DEGs, all DEGs were mapped to GO terms in the database, the total numbers of genes for each term were calculated and a hypergeometric test were used. Taking corrected p-value ≤ 0.05 as a threshold, significantly enriched GO terms for DEGs were acquired. Then, a Blast2GO program [58] and WEGO software [59] were used to obtain GO functional classifications for DEGs following default parameters. Similarly, all DEGs were mapped to the KEGG database for KEGG pathway enrichment analysis of DEGs.
Validation DEGs by qRT-PCR
Real-time quantitative RT-PCR was used to validate the expression of a selected set of DEGs. Six primer pairs were designed with the Primer 3.0 (http://primer3.ut.ee/) program, to produce a 150 bp amplicon, based on lily transcriptome database L.-Unigene-All (Additional file 13: Table S12). After a preliminary experiment for evaluation of candidate reference genes, actin (forward primer sequence CACACTGGTGTCATGGTTGG; reverse primer sequence CACAATACC GTGCTCAATTGG), was used as an internal control. Real-time PCR reactions were performed using a 7500 Real Time PCR System (Thermo Fisher Scientific), in a total of 20 μl, with 1 μl cDNA, 0.8 μl forward primer (10 μM), 0.8 μl reverse primer (μM), 0.4 μl ROX, and 10 μl SYBR® Premix Ex TaqTM II(2×). The cycling conditions were as follows: 95 °C for 3 min, 40 cycles of 95 °C for 30 s, 55 °C for 30 s, and 72 °C for 1 min. Melting curves for each PCR product were analyzed at 95 °C for 15 s, cooling to 54 °C for 1 min, and then gradually heated at 0.1 °C/s to a final temperature of 95 °C. Relative quantitation (RQ) was calculated using the 2 − ΔΔCt method. Three RNA isolations and triplicate RT-PCR runs were implemented for each sample for biological and technical replication.
Cloning and nucleotide analysis of TPS gene
Gene cloning primers were designed taking sequences of transcript CL4520.Contig5_All from L.-Unigene-All as template. Forward primer (ATGGCAGCTATGAGCTGT) and reverse primer (TCATTCCAATGGGACATTATTG) were synthesized by Sangon Biotech. The PCR was performed with a Gene Amp kit (Transgen Biotech, China) according to the manufacturer’s instructions, in a total of 50 μl, with 4 μl of petal cDNA, 1 μl forward primer (10 μM), 1 μl reverse primer (μM), 5 μl TransTaq-T buffer, 4 μl 2.5 mM dNTPs, and 1 μl TransTaq-T DNA Polymerase. The cycling conditions were as follows: 94 °C for 5 min, 35 cycles of 94 °C for 30 s, 55 °C for 30 s, and 72 °C for 1 min. Following detection and excision from the agarose, the fragment was subsequently cloned into pMD 19-T vector and transformed into Trans5α E. coli cell according to the manufacturer’s protocol (Transgen Biotech, China). Three clones screened and vetted for amplicons of appropriate size were sequenced by Sangon Biotech. Multiple sequence alignment of plant TPS gene was performed using DNAMAN 8.0 (Lynnon Biosoft, USA) and a phylogenetic tree was constructed using MEGA5 with a bootstrap replication of 1000.
Identification of transcription factor
Transcriptome database L.-Unigene-All was used for transcription factor identification against the Plant Transcription Factor Database PlnTFDB (http://plntfdb.bio.uni-potsdam.de/v3.0/downloads.php) using BLASTX with an E-value cut-off of ≤ 10−5.
Construction of gene expression profiles and gene co-expression network
HemI 1.0.3.7 [60] was used to construct a heatmap of DGEs related to monoterpene biosynthesis and expression profiles of transcription factors. Pearson correlation coefficient (PCC) were calculated between the two genes from two data sets, DEGs related to flower fragrance (Additional file 8: Table S8) and the expressed identified TFs. TFs with |PCC| ≥ 0.95 (p<0.01) were selected for co-expression network construction from the DEGs related to flower fragrance. The networks were visualized using Cytoscape _v.3.3.0 [61].
Additional files
Mapping reads alignment results for the discarded leaf sample. (XLSX 10 kb)
Original data for RPKM values and functional annotation of all transcripts. (XLS 33444 kb)
Review of common unigenes in flower, leaf and scale. (XLSX 13 kb)
Flower-specific genes. (XLSX 38 kb)
Leaf-specific genes. (XLSX 47 kb)
Scale-specific genes. (XLSX 36 kb)
Differentially expressed genes involved in flavonoid biosynthesis. (XLSX 17 kb)
Differentially expressed genes related to flower fragrance. (XLSX 16 kb)
Differentially expressed genes involved in photosynthesis. (XLSX 21 kb)
Differentially expressed genes involved in metabolism of starch and sucrose. (XLSX 18 kb)
Review of structural genes related to flower fragrance and their highly correlated transcript factors. (XLSX 23 kb)
Alignment of deduced amino acid sequences of LsTPS with sequences from different fragrant plants. Constructed using MEGA5 with a bootstrap replications of 1000. (PDF 61 kb)
Primer sequences used for qRT-PCR validation of RNA-seq data. (PDF 135 kb)
Acknowledgments
The authors thank Gene de novo Biotechnology (Guangzhou, China) for providing support on construction of regulatory networks.
Funding
This work was sponsored by the Natural Science Foundation of Shanxi, China (No. 201601D011077); Supporting Talent Research Project of Shanxi Agricultural University, China (No. 2014ZZ02); National Natural Science Foundation of China (No. 31772337). The funding agency had no role in the design of the study, collection, analysis, and interpretation of data, or writing the manuscript.
Availability of data and materials
The sequence datasets used as reference transcriptome, L.-Unigene-All, are available at the NCBI TSA database with accession number SUB2623518.
The sequence datasets supporting the genes used in this article are available at the NCBI SRA database with accession number SRP084220.
The sequence of LsTPS open reading frame cloned in this study are available at the NCBI Nucleotide database with accession number MF401556.
Abbreviations
- AGP
ADP-glucose pyrophosphorylase
- BAM
β-amylase
- CHI
Chalcone isomerase
- CHS
Chalcone synthase
- DEGs
Differentially expressed genes
- DFR
Dihydroflavonol 4-reductase
- DGE
Digital gene expression
- DXS
1-deoxy-D-xylulose-5-phosphate synthase
- F3H
Flavanone 3-hdroxylase
- FLS
Flavonol synthase
- F-vs-S
Flowers-vs-scales
- GGPP
Geranylgeranyl pyrophosphate
- GO
Gene Ontology
- HCT
Shikimate O-hydroxycinnamoyltransferase
- HDS
4-hydroxy-3-methylbut-2-en- 1-yl diphosphate
- HPL
Hydroperoxide lyase
- INV
Invertase
- KAT
3-ketoacyl-CoA thiolase
- KEGG
Kyoto Encyclopedia of Genes and Genomes
- LAR
Leucoanthocyanidin reductase
- LDOX
Leucoanthocyanidin dioxygenase
- L-vs-F
Leaf-vs-flower
- L-vs-S
Leaves-vs-scales
- qRT-PCR
quantitative real time PCR
- RPKM
Reads per kb per million reads
- SBE
starch branching enzyme
- SPS
Sucrose phosphate synthase
- SS
Sucrose synthase
- SSS
Starch synthase
- TPS
terpene synthase
- TT7
Flavonoid 3′-monooxygenase
Author’s contributions
ZSG and YPX conceived and designed the experiment. JMF and TW participated in RNA extraction, carried out the quantitative real-time PCR and gene clone. FD analyzed the sequence data and drafted the manuscript. YW participated in data analysis and manuscript drafting. DG, ZSG and YPX revised the manuscript. All authors read and approved the final manuscript.
Ethics approval and consent to participate
Plant materials in this study were collected from our own experimental field in the Institute of Landscape Architecture, Zhejiang University (ZJU), China. Lily bulbs were bought form Beijing Clover Company. It was not necessary to obtain any field permissions to collect the plant samples used in this study. Our experimental research complies with institutional, national and international guidelines.
Consent for publication
Not applicable.
Competing interests
The authors declare that they have no competing interests.
Publisher’s Note
Springer Nature remains neutral with regard to jurisdictional claims in published maps and institutional affiliations.
Footnotes
Electronic supplementary material
The online version of this article (10.1186/s12864-017-4303-4) contains supplementary material, which is available to authorized users.
Contributor Information
Fang Du, Email: df730227@yeah.net.
Junmiao Fan, Email: 1416871507@qq.com.
Ting Wang, Email: 1152245453@qq.com.
Yun Wu, Email: meimeiyu@zju.edu.cn.
Donald Grierson, Email: donald.grierson@nottingham.ac.uk.
Zhongshan Gao, Phone: 86-0571-8898225, Email: gaozhongshan@zju.edu.cn.
Yiping Xia, Phone: 86-0571-8898225, Email: ypxia@zju.edu.cn.
References
- 1.Bowman JL, Smyth DR, Meyerowitz EM. The ABC model of flower development: then and now. Development. 2012;139(22):4095–4098. doi: 10.1242/dev.083972. [DOI] [PubMed] [Google Scholar]
- 2.Lin Z, Hong Y, Yin M, Li C, Zhang K, Grierson D. A tomato HD-zip homeobox protein, LeHB-1, plays an important role in floral organogenesis and ripening. Plant J. 2008;55(2):301–310. doi: 10.1111/j.1365-313X.2008.03505.x. [DOI] [PMC free article] [PubMed] [Google Scholar]
- 3.Zhang C, Xu Y, Guo S, Zhu J, Huan Q, Liu H, Wang L, Luo G, Wang X, Chong K. Dynamics of brassinosteroid response modulated by negative regulator LIC in rice. PLoS Genet. 2012;8(4):e1002686. doi: 10.1371/journal.pgen.1002686. [DOI] [PMC free article] [PubMed] [Google Scholar]
- 4.Zimmermann R, Sakai H, Hochholdinger F. The Gibberellic acid stimulated-like gene family in maize and its role in lateral root development. Plant Physiol. 2010;152(1):356–365. doi: 10.1104/pp.109.149054. [DOI] [PMC free article] [PubMed] [Google Scholar]
- 5.Leeggangers HA, Moreno-Pachon N, Gude H, Immink RG. Transfer of knowledge about flowering and vegetative propagation from model species to bulbous plants. Int J Dev Biol. 2013;57(6–8):611–620. doi: 10.1387/ijdb.130238ri. [DOI] [PubMed] [Google Scholar]
- 6.Leitch IJ, Beaulieu JM, Cheung K, Hanson L, Lysak MA, Fay MF. Punctuated genome size evolution in Liliaceae. J Evol Biol. 2007;20(6):2296–2308. doi: 10.1111/j.1420-9101.2007.01416.x. [DOI] [PubMed] [Google Scholar]
- 7.Moreno-Pachon NM, Leeggangers HA, Nijveen H, Severing E, Hilhorst H, Immink RG. Elucidating and mining the Tulipa and Lilium transcriptomes. Plant Mol Biol. 2016;92(3):249–261. doi: 10.1007/s11103-016-0508-1. [DOI] [PMC free article] [PubMed] [Google Scholar]
- 8.Riesgo A, Andrade SCS, Sharma PP, Novo M, Pérez-Porro AR, Vahtera V, González VL, Kawauchi GY, Giribet G. Comparative description of ten transcriptomes of newly sequenced invertebrates and efficiency estimation of genomic sampling in non-model taxa. Front Zool. 2012;9:33. doi: 10.1186/1742-9994-9-33. [DOI] [PMC free article] [PubMed] [Google Scholar]
- 9.Villacorta-Martin C, Haan JD, Huijben K, Passarinho P, Hamo LB, Zaccai M. Whole transcriptome profiling of the vernalization process in Lilium longiflorum (cultivar white heaven) bulbs. BMC Genomics. 2015;16(1):1–16. doi: 10.1186/1471-2164-16-1. [DOI] [PMC free article] [PubMed] [Google Scholar]
- 10.Wang J, Wang Q, Yang Y, Liu X, Gu J, Li W, Ma S, Lu Y. De novo assembly and characterization of stress transcriptome and regulatory networks under temperature, salt and hormone stresses in Lilium lancifolium. Mol Biol Rep. 2014;41(12):8231–8245. doi: 10.1007/s11033-014-3725-1. [DOI] [PubMed] [Google Scholar]
- 11.Li X, Wang C, Cheng J, Zhang J, da Silva JA, Liu X, Duan X, Li T, Sun H. Transcriptome analysis of carbohydrate metabolism during bulblet formation and development in Lilium davidii Var. unicolor. BMC Plant Biol. 2014;14(1):358. doi: 10.1186/s12870-014-0358-4. [DOI] [PMC free article] [PubMed] [Google Scholar]
- 12.Zhu X, Chai M, Li Y, Sun M, Zhang J, Sun G, Jiang C, Shi L. Global transcriptome profiling analysis of inhibitory effects of paclobutrazol on leaf growth in lily (Lilium Longiflorum-Asiatic hybrid). Front Plant Sci. 2016;7 [DOI] [PMC free article] [PubMed]
- 13.Lang V, Usadel B, Obermeyer G. De novo sequencing and analysis of the lily pollen transcriptome: an open access data source for an orphan plant species. Plant Mol Biol. 2015;87(1–2):69–80. doi: 10.1007/s11103-014-0261-2. [DOI] [PubMed] [Google Scholar]
- 14.Liu X, Huang J, Wang J, Lu Y. RNA-Seq analysis reveals genetic bases of the flowering process in oriental hybrid lily cv. Sorbonne Russ J Plant Physl. 2014;61(6):880–892. doi: 10.1134/S1021443714060132. [DOI] [Google Scholar]
- 15.Zhang MF, Jiang LM, Zhang DM, Jia GX. De novo transcriptome characterization of Lilium ‘Sorbonne’ and key enzymes related to the flavonoid biosynthesis. Mol Genet Genomics. 2015;290(1):399–412. doi: 10.1007/s00438-014-0919-0. [DOI] [PubMed] [Google Scholar]
- 16.Xu L, Yang P, Feng Y, Xu H, Cao Y, Tang Y, Yuan S, Liu X, Ming J. Spatiotemporal transcriptome analysis provides insights into bicolor tepal development in Lilium “tiny Padhye”. Front Plant Sci. 2017;8:398. doi: 10.3389/fpls.2017.00398. [DOI] [PMC free article] [PubMed] [Google Scholar]
- 17.Shahin A, Arens P, Van Heusden AW, Van Der Linden G, Van Kaauwen M, Khan N, Schouten HJ, Van De Weg WE, Visser RGF, Van Tuyl JM. Genetic mapping in Lilium: mapping of major genes and quantitative trait loci for several ornamental traits and disease resistances. Plant Breed. 2011;130(3):372–382. doi: 10.1111/j.1439-0523.2010.01812.x. [DOI] [Google Scholar]
- 18.Benjamini Y, Hochberg Y. Controlling the false discovery rate. A practical and powerful approach to multiple testing. J R Stat Soc. 1995;57(1):289–300. [Google Scholar]
- 19.Kong Y, Sun M, Pan HT, Zhang QX. Composition and emission rhythm of floral scent volatiles from eight lily cut flowers. J Amer Soc Hort Sci. 2012;137(6):376–382. [Google Scholar]
- 20.Johnson TS, Schwieterman ML, Kim JY, Cho KH, Clark DG, Colquhoun TA. Lilium floral fragrance: a biochemical and genetic resource for aroma and flavor. Phytochemistry. 2016;122:103–112. doi: 10.1016/j.phytochem.2015.11.010. [DOI] [PubMed] [Google Scholar]
- 21.Zhang HX, Zeng-Hui HU, Leng PS, Wang WH, Fang XU, Zhao J. Qualitative and quantitative analysis of floral volatile components from different varieties of Lilium spp. Sci Agr Sinica. 2013;46(4):790–799. [Google Scholar]
- 22.Chang YT, Chu FH. Molecular cloning and characterization of monoterpene synthases from Litsea cubeba (lour.) Persoon. Tree Genet Genom. 2011;7(4):835–844. doi: 10.1007/s11295-011-0377-3. [DOI] [Google Scholar]
- 23.He XL, Shi LW, Yuan ZH, Xu Z, Zhang ZQ, Yi MF. Effects of lipoxygenase on the corm formation and enlargement in Gladiolus hybridus. Sci Hortic. 2008;118(1):60–69. doi: 10.1016/j.scienta.2008.05.019. [DOI] [Google Scholar]
- 24.Yu Z, Chen LC, Suzuki H, Ariyada O, Erra-Balsells R, Nonami H, Hiraoka K. Direct profiling of phytochemicals in tulip tissues and in vivo monitoring of the change of carbohydrate content in tulip bulbs by probe electrospray ionization mass spectrometry. J Am Soc Mass Spectrom. 2009;20(12):2304–2311. doi: 10.1016/j.jasms.2009.08.023. [DOI] [PubMed] [Google Scholar]
- 25.Kong Y, Dou XY, Bao F, Lang LX, Bai JR. Advances in flower color mechanism of Lilium. Acta Hort Sinica. 2015;42(9):1747–1759. [Google Scholar]
- 26.Grotewold E. The genetics and biochemistry of floral pigments. Annu Rev Plant Biol Plant Biology. 2006;57(57):761–780. doi: 10.1146/annurev.arplant.57.032905.105248. [DOI] [PubMed] [Google Scholar]
- 27.Koes R, Verweij W, Quattrocchio F. Flavonoids: a colorful model for the regulation and evolution of biochemical pathways. Trends Plant Sci. 2005;10(5):236–242. doi: 10.1016/j.tplants.2005.03.002. [DOI] [PubMed] [Google Scholar]
- 28.Nakatsuka A, Izumi Y, Yamagishi M. Spatial and temporal expression of chalcone synthase and dihydroflavonol 4-reductase genes in the Asiatic hybrid lily. Plant Sci. 2003;165(4):759–767. doi: 10.1016/S0168-9452(03)00254-1. [DOI] [Google Scholar]
- 29.An L, Yang K, Zhang K, Zhao X, Wang W, Yang L, Wang J. Cloning and analysis of Chalcone synthase gene of lily. Acta Bot Boreal Occident Sin. 2011;31(3):0492–0498. [Google Scholar]
- 30.Yamagishi M. Oriental hybrid lily Sorbonne homologue of LhMYB12 regulates anthocyanin biosyntheses in flower tepals and tepal spots. Mol Breeding. 2010;28(3):381–389. doi: 10.1007/s11032-010-9490-5. [DOI] [PubMed] [Google Scholar]
- 31.Tang B, Zenghui HU, Leng P, Yan J, Xiuyun WU. The expression of monoterpene synthase genes in Lilium with strong and light floral fragrance. J BJ Univ Agr. 2016;31(2):88–94. [Google Scholar]
- 32.Ll L, Wang H, Sun M, Zhang QX. Molecular cloning and expression analysis of a monoerpene synthase gene in Lilium regale. J FJ Agr For Univ. 2014;43(4):397–401. [Google Scholar]
- 33.Li TJ, Leng PS, Yang K, Zheng J, Hui HZ. Molecular cloning and characterization of monoterpene synthase gene in Lilium flowers. J BJ Univ Agr. 2014;29(3):6–10. [Google Scholar]
- 34.Cordoba E, Salmi M, León P. Unravelling the regulatory mechanisms that modulate the MEP pathway in higher plants. J Exp Bot. 2009;60(10):2933–2943. doi: 10.1093/jxb/erp190. [DOI] [PubMed] [Google Scholar]
- 35.Battilana J, Costantini L, Emanuelli F, Sevini F, Segala C, Moser S, Velasco R, Versini G, Grando MS. The 1-deoxy- d -xylulose 5-phosphate synthase gene co-localizes with a major QTL affecting monoterpene content in grapevine. Theor Appl Genet. 2009;118(4):653–669. doi: 10.1007/s00122-008-0927-8. [DOI] [PubMed] [Google Scholar]
- 36.Lois LM, Rodríguezconcepción M, Gallego F, Campos N, Boronat A. Carotenoid biosynthesis during tomato fruit development: regulatory role of 1-deoxy-D-xylulose 5-phosphate synthase. Plant J Cell Molr Biol. 2000;22(6):503–513. doi: 10.1046/j.1365-313x.2000.00764.x. [DOI] [PubMed] [Google Scholar]
- 37.Kim JS, Kim JH. Comparative genome analysis and phylogenetic relationship of order Liliales insight from the complete plastid genome sequences of two lilies (Lilium longiflorum and Alstroemeria aurea) PLoS One. 2013;8(6):e68180. doi: 10.1371/journal.pone.0068180. [DOI] [PMC free article] [PubMed] [Google Scholar]
- 38.Givnish TJ, Ames M, McNeal JR, McKain MR, Steele PR, dePamphilis CW, Graham SW, Pires JC, Stevenson DW, Zomlefer WB, et al. Assembling the tree of the monocotyledons: plastome sequence phylogeny and evolution of poales. Ann Mo Bot Gard. 2010;97(4):584–616. doi: 10.3417/2010023. [DOI] [Google Scholar]
- 39.Wang XN, Xiong L, Wu XW, Wang QG, Chen M, Bao LX. Relationship between starch saccharification and propagation of bulblets from scales in oriental hybrid lily (Lilium L.) SW China J Agr Sci. 2007;01:115–119. [Google Scholar]
- 40.Xia YP, Zheng HJ, Huang CH, Xu WW. Accumulation and distribution of 14C-photosynthate during bulb developemnt of Lilium oriental hybrid. J Nucl Agril Sci. 2006;20(5):417–422. [Google Scholar]
- 41.Kawagishi K, Miura T. Growth characteristics and effect of nitrogen and potassium topdressing on thickening growth of bulbs in spring-planted edible lily (Lilium leichtlinii Var. maximowiczii baker) JPN J Crop Sci. 1996;65(1):51–57. doi: 10.1626/jcs.65.51. [DOI] [Google Scholar]
- 42.Wu SS, Wu JD, Jiao XH, Zhang QX, Lv YM. The dynamics of changes in starch and lipid droplets and sub-cellular localization of β-amylase during the growth of lily bulbs. J Integr Agri. 2012;11(4):585–592. doi: 10.1016/S2095-3119(12)60045-8. [DOI] [Google Scholar]
- 43.Hobert O. Gene regulation by transcription factors and microRNAs. Science. 2008;319(5871):1785–1786. doi: 10.1126/science.1151651. [DOI] [PubMed] [Google Scholar]
- 44.Spyropoulou EA, Haring MA, Schuurink RC. RNA sequencing on Solanum lycopersicum, trichomes identifies transcription factors that activate terpene synthase promoters. BMC Genomics. 2014;15(1):402. doi: 10.1186/1471-2164-15-402. [DOI] [PMC free article] [PubMed] [Google Scholar]
- 45.Mertens J, Moerkercke AV, Bossche RV, et al. Clade IVa basic helix–loop–helix transcription factors form part of a conserved jasmonate signaling circuit for the regulation of bioactive plant terpenoid biosynthesis. Plant Cell Physiol. 2016;57(12):2564–2575. doi: 10.1093/pcp/pcw168. [DOI] [PubMed] [Google Scholar]
- 46.Yu ZX, Li JX, Yang CQ, Hu WL, Wang LJ, Chen XY. The jasmonate-responsive AP2/ERF transcription factors AaERF1 and AaERF2 positively regulate artemisinin biosynthesis in Artemisia annua L. Mol Plant. 2012;5(2):353–365. doi: 10.1093/mp/ssr087. [DOI] [PubMed] [Google Scholar]
- 47.Shen SL, Yin XR, Zhang B, Xie XL, Jiang Q, Grierson D, et al. CitAP2.10 activation of the terpene synthase CsTPS1 is associated with the synthesis of (+)-valencene in ‘Newhall’ orange. J Exp Bot. 2016;67(14):4105–4115. doi: 10.1093/jxb/erw189. [DOI] [PMC free article] [PubMed] [Google Scholar]
- 48.Mutz KO, Heilkenbrinker A, Lonne M, Walter JG, Stahl F. Transcriptome analysis using next-generation sequencing. Curr opin biotech. 2013;24(1):22–30. doi: 10.1016/j.copbio.2012.09.004. [DOI] [PubMed] [Google Scholar]
- 49.Yang F, Zhu G, Wang Z, Liu H, Xu Q, Huang D, Zhao C. Integrated mRNA and microRNA transcriptome variations in the multi-tepal mutant provide insights into the floral patterning of the orchid Cymbidium goeringii. BMC Genomics. 2017;18(1):367. doi: 10.1186/s12864-017-3756-9. [DOI] [PMC free article] [PubMed] [Google Scholar]
- 50.Li XW, Jiang J, Zhang LP, Yu Y, Ye ZW, Wang XM, Zhou JY, Chai ML, Zhang HQ, Arús P, et al. Identification of volatile and softening-related genes using digital gene expression profiles in melting peach. Tree Genet Genom. 2015;11(4):71. doi: 10.1007/s11295-015-0891-9. [DOI] [Google Scholar]
- 51.Zu K, Li J, Dong S, Zhao Y, Xu S, Zhang Z, Zhao L. Morphogenesis and global analysis of transcriptional profiles of Celastrus orbiculatus aril: unravelling potential genes related to aril development. Genes Genom. 2017;39(6):623–635. doi: 10.1007/s13258-017-0528-5. [DOI] [Google Scholar]
- 52.Savchenko T, Yanykin D, Khorobrykh A, Terentyev V, Klimov V, Dehesh K. The hydroperoxide lyase branch of the oxylipin pathway protects against photoinhibition of photosynthesis. Planta. 2017;245(6):1179–1192. doi: 10.1007/s00425-017-2674-z. [DOI] [PubMed] [Google Scholar]
- 53.Du F, Wu Y, Zhang L, Li XW, Zhao XY, Wang WH, Gao ZS, Xia YP. De novo assembled transcriptome analysis and SSR marker development of a mixture of six tissues from Lilium oriental hybrid ‘Sorbonne’. Plant Mol Biol Rep. 2014;33(2):1–13. [Google Scholar]
- 54.Shan L, Li X, Wang P, Cai C, Zhang B, De Sun C, Zhang W, Xu C, Ferguson I, Chen K. Characterization of cDNAs associated with lignification and their expression profiles in loquat fruit with different lignin accumulation. Planta. 2008;227(6):1243. doi: 10.1007/s00425-008-0696-2. [DOI] [PubMed] [Google Scholar]
- 55.Feng C, Chen M, Xu CJ, Bai L, Yin XR, Li X, Allan AC, Ferguson IB, Chen KS. Transcriptomic analysis of Chinese bayberry (Myrica rubra) fruit development and ripening using RNA-Seq. BMC Genomics. 2012;13:19. doi: 10.1186/1471-2164-13-19. [DOI] [PMC free article] [PubMed] [Google Scholar]
- 56.Li R, Yu C, Li Y, Lam TW, Yiu SM, Kristiansen K, Wang J. SOAP2: an improved ultrafast tool for short read alignment. Bioinformatics. 2009;25(15):1966–1967. doi: 10.1093/bioinformatics/btp336. [DOI] [PubMed] [Google Scholar]
- 57.Tarazona S, García-Alcalde F, Dopazo J, Ferrer A, Conesa A. Differential expression in RNA-seq: a matter of depth. Genome Res. 2011;21(12):2213–2223. doi: 10.1101/gr.124321.111. [DOI] [PMC free article] [PubMed] [Google Scholar]
- 58.Conesa A, Gotz S, Garcia-Gomez JM, Terol J, Talon M, Robles M. Blast2GO: a universal tool for annotation, visualization and analysis in functional genomics research. Bioinformatics. 2005;21(18):3674–3676. doi: 10.1093/bioinformatics/bti610. [DOI] [PubMed] [Google Scholar]
- 59.Ye J, Fang L, Zheng H, Zhang Y, Chen J, Zhang Z, Wang J, Li S, Li R, Bolund L, et al. WEGO: a web tool for plotting GO annotations. Nucleic Acids Res. 2006;34:293–297. doi: 10.1093/nar/gkl031. [DOI] [PMC free article] [PubMed] [Google Scholar]
- 60.Deng WK, Wang YB, Liu ZX, Cheng H, Xue Y. HemI: a toolkit for illustrating heatmaps. PLoS One. 2014;9(11):e111988. doi: 10.1371/journal.pone.0111988. [DOI] [PMC free article] [PubMed] [Google Scholar]
- 61.Shannon P, Markiel A, Ozier O, Baliga NS, Wang JT, Ramage D, et al. Cytoscape: a software environment for integrated models of biomolecular interaction networks. Genome Res. 2003;13(11):2498–2504. doi: 10.1101/gr.1239303. [DOI] [PMC free article] [PubMed] [Google Scholar]
Associated Data
This section collects any data citations, data availability statements, or supplementary materials included in this article.
Supplementary Materials
Mapping reads alignment results for the discarded leaf sample. (XLSX 10 kb)
Original data for RPKM values and functional annotation of all transcripts. (XLS 33444 kb)
Review of common unigenes in flower, leaf and scale. (XLSX 13 kb)
Flower-specific genes. (XLSX 38 kb)
Leaf-specific genes. (XLSX 47 kb)
Scale-specific genes. (XLSX 36 kb)
Differentially expressed genes involved in flavonoid biosynthesis. (XLSX 17 kb)
Differentially expressed genes related to flower fragrance. (XLSX 16 kb)
Differentially expressed genes involved in photosynthesis. (XLSX 21 kb)
Differentially expressed genes involved in metabolism of starch and sucrose. (XLSX 18 kb)
Review of structural genes related to flower fragrance and their highly correlated transcript factors. (XLSX 23 kb)
Alignment of deduced amino acid sequences of LsTPS with sequences from different fragrant plants. Constructed using MEGA5 with a bootstrap replications of 1000. (PDF 61 kb)
Primer sequences used for qRT-PCR validation of RNA-seq data. (PDF 135 kb)
Data Availability Statement
The sequence datasets used as reference transcriptome, L.-Unigene-All, are available at the NCBI TSA database with accession number SUB2623518.
The sequence datasets supporting the genes used in this article are available at the NCBI SRA database with accession number SRP084220.
The sequence of LsTPS open reading frame cloned in this study are available at the NCBI Nucleotide database with accession number MF401556.