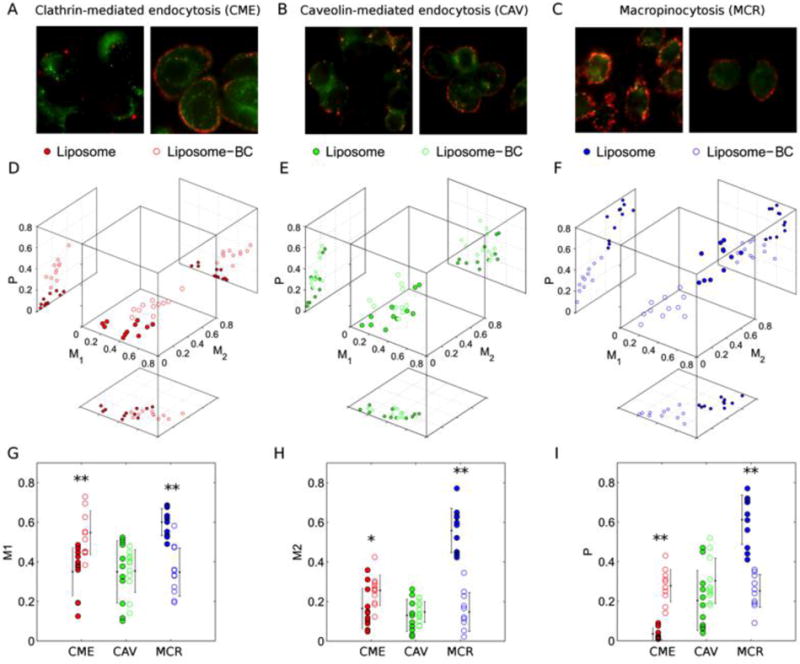
Figure 1.

Dual color fluorescence images of red-labeled liposomes, liposome-BC complexes and green-labeled endocytic vesicles corresponding to (A) Clathrin-mediated endocytosis (CME), (B) Caveolin-mediated endocytosis (CAV) CAV and (C) Macropinocytosis (MCR). (D, E, F) Measured values of Manders’ (M1, M2) and Pearson’s (P) coefficients as multivariate distributions and (G, H, I) corresponding 1D projections. Asterisks refer to Student’s t-test significance, in terms of p-values below (*) 0.01 and (**) 0.005
