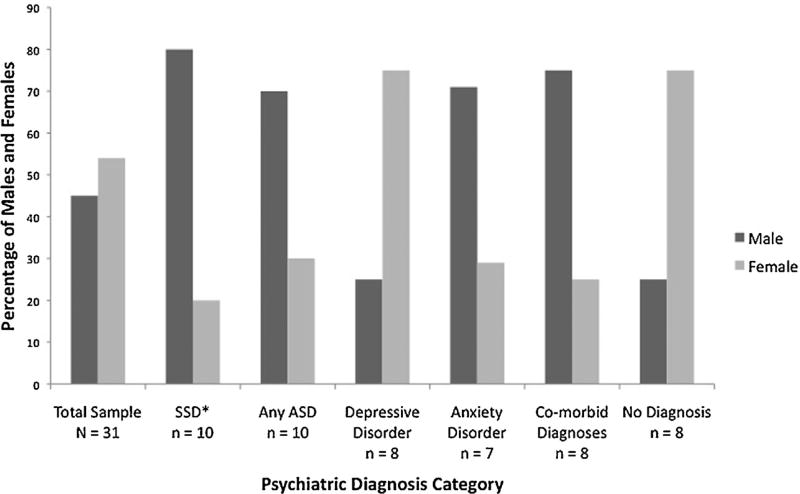
Fig. 1.
Percent of males and females within each diagnostic category. The percent of males and females is shown for the following: the total sample, those meeting criteria for a schizophrenia spectrum disorder (SSD), an autism spectrum disorder (diagnosed with CPEA-defined or DSM-IV-defined criteria), a depressive disorder, and an anxiety disorder, as well as those meeting criteria for more than one psychiatric disorder (co-morbid diagnoses) or no psychiatric disorder (no diagnosis). Using Fisher’s exact test, the male to female ratio for the SSD group was significantly different than the male to female ratio for all research participants without an SSD diagnosis (P < 0.05). Other comparisons did not reach significance at the P < 0.05 level.

