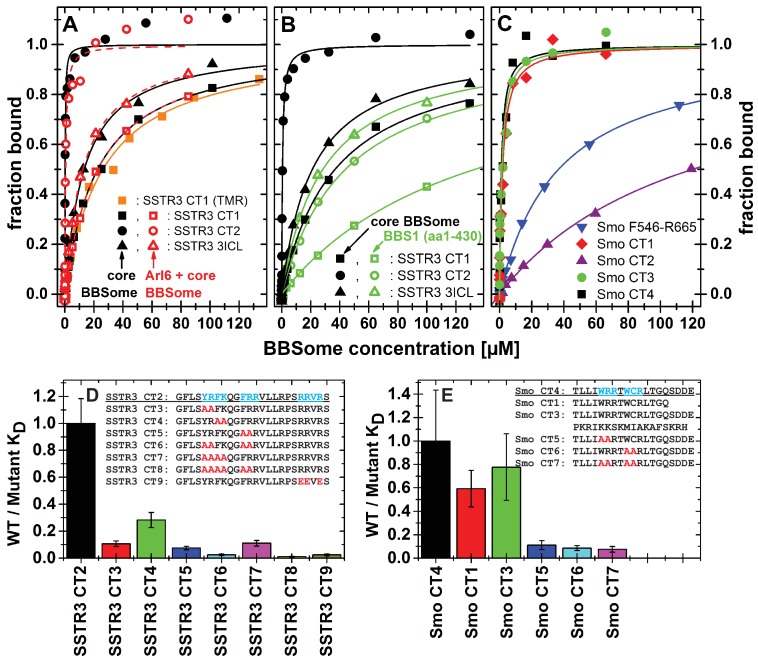
Figure 5. Cargo binding to the core BBSome with fluorescence polarization, measured by using fluorescently labeled peptides and the purified core BBSome.
(A,B) Fluorescent peptides, synthesized as described in methods, from the third intracellular loop of SSTR3 (SSTR3 CT1, SSTR3 CT2) or its C-terminal region (SSTR3 3ICL) were titrated with increasing concentrations of the core BBSome (filled black symbols) or equimolar mixtures of core BBSome with Arl6•GppNHp (open red symbols, A) or BBS1 (aa1-430) (open green symbols, B). All peptides were N-terminally labeled with fluorescein, with an exception of a C-terminally TMR-labeled SSTR3 CT1 peptide (orange squares) that was used as a control to exclude nonspecific binding events due to the used fluorophore. The increase in fluorescence polarization was fitted to a binding curve as described in the methods section, and the resulting maximal polarization from the fit was defined as 100% of peptide bound to the complex (fraction bound = 1). (Data points exceeding this mark might indicate secondary binding events at high BBSome concentrations). (C) Fluorescent peptides from the C-terminus of Smo (Smo CT1-4) and a truncated Smoothened construct (Smo F546-R665) were analyzed as described above. (D) The peptide SSTR3 CT2 that bound with highest affinity to the core BBSome was used as a template for the design and analysis of mutant peptides (SSTR3 CT3-9) with substitutions of one or multiple residues as indicated. Polarization experiments were performed as described above and dissociation constants (KD) are presented as ratios to the KD of the wild type peptide as a bar diagram. (E) Bar diagram of the relative affinities of SmoCT1 and CT3 relative to SmoCT4, as determined in C, and of mutant Smo CT4 peptides with substitutions as indicated.


