
Figure 3. Normal expression and subcellular distribution of otoferlin in Otof C2C/C2C IHCs.
(A) Confocal microscopy images of IHCs from whole-mount preparations of the organ of Corti from P15 Otof C2C/+ and Otof C2C/C2C mice triple-labeled for otoferlin (blue), ribeye (red), and postsynaptic GluA2 receptors (green). Insets: detailed views of the boxed synaptic areas. n: cell nucleus. Scale bar: 5 µm. Inset scale bar: 1 µm. (B) Confocal microscopy image of IHCs from a whole-mount preparation of an organ of Corti from a P15 Otof -/- mouse triple-labeled for otoferlin (green), the hair cell marker myosin VI (red), and the cell nucleus marker DAPI (blue). Note that the luminosity of the green channel (otoferlin) has been enhanced to show the absence of otoferlin expression in Otof -/- mice. Scale bar: 5 µm. (C) Top: Summed projected z-stack confocal microscopy images of IHCs from whole-mount preparations of organs of Corti from P15 Otof C2C/+ and Otof C2C/C2C mice labeled for otoferlin (green). Scale bar: 5 µm. Bottom: Quantification of otoferlin fluorescence in Otof C2C/+ (n = 51 cells in 7 mice) and Otof C2C/C2C IHCs (n = 51 cells from 7 mice) at the apex, middle, and the base of IHCs. Data information: in (C), data are presented as the mean ± SEM. ns, not significant (Student's t-test with Welch correction).

Figure 3—figure supplement 1. Normal number of ribbon synapses in Otof C2C/C2C IHCs.
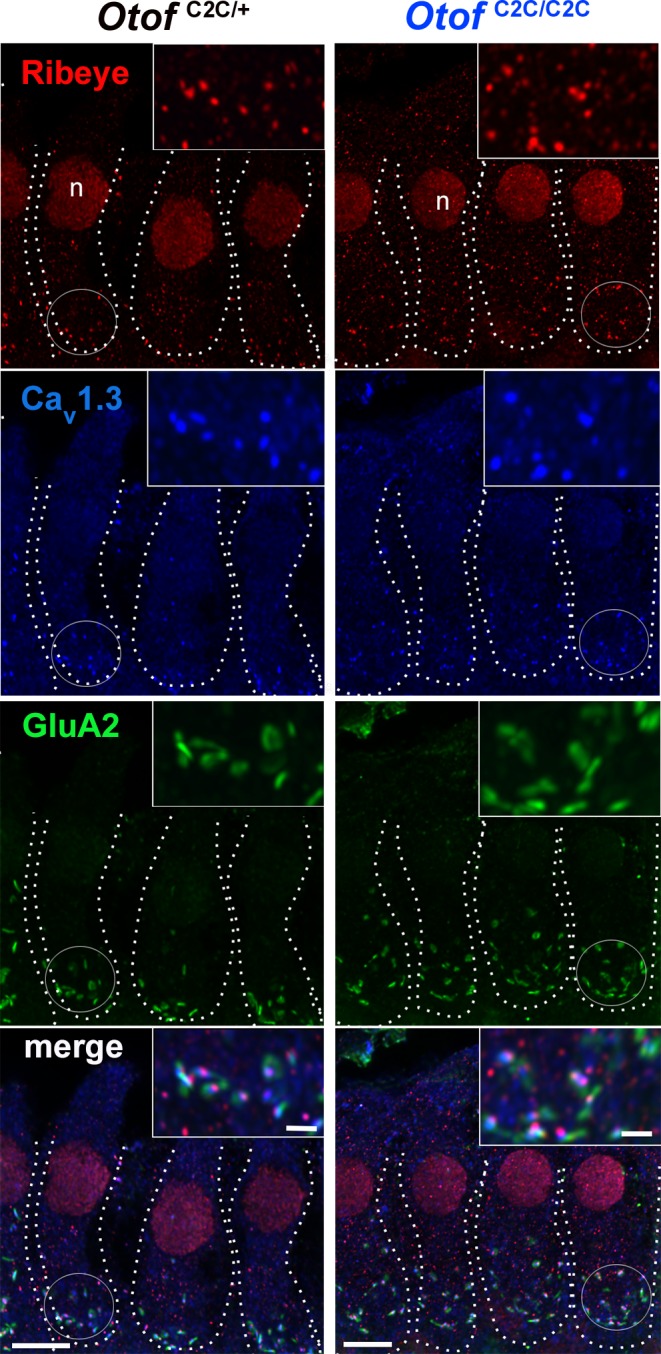
Figure 3—figure supplement 2. Normal colocalization of otoferlin and Vglut3 in Otof C2C/C2C IHCs.
