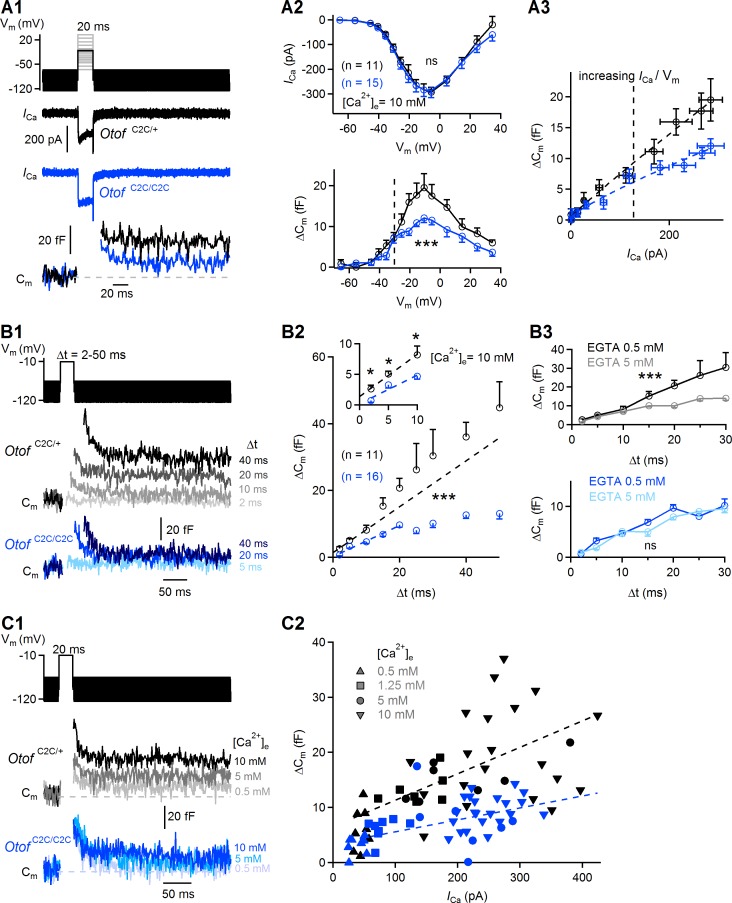
Figure 5. Ca2+-dependence of the RRP vesicle fusion defect in Otof C2C/C2C IHCs.
(A1) Protocol used to depolarize IHCs from −95 mV to potentials between −65 to +35 mV (top). Examples of Ca2+ currents (ICa) (middle) and corresponding Cm traces (bottom) for P15-P18 Otof C2C/+ and Otof C2C/C2C IHCs after 20 ms of depolarization to −10 mV. (A2) Mean Ca2+ current amplitudes (ICa) (top) and ΔCm (bottom) for P15-P18 Otof C2C/+ and Otof C2C/C2C IHCs after 20 ms of depolarization to potentials between −65 mV to +35 mV. The vertical dashed line indicates the −30 mV voltage point. (A3) Mean ΔCm values plotted against the Ca2+ currents elicited by depolarizing steps to potentials underlying the falling segment of the ICa/Vm curve (−65 mV to −10 mV), corresponding to increasing Ca2+ currents. The vertical dashed line indicates the −30 mV voltage point. The Otof C2C/+ and Otof C2C/C2C ΔCm data were fitted with a power function, yielding an exponent of 0.94 and 0.83, respectively. (B1) Protocol used to depolarize IHCs from −95 mV to −10 mV for voltage steps of different durations from 2 ms to 50 ms (top). Corresponding example Cm traces from P15-P18 Otof C2C/+ and Otof C2C/C2C IHCs (bottom). The example traces for each genotype come from the same patch-clamped IHC. (B2) Kinetics of Ca2+-dependent exocytosis in P15-P18 Otof C2C/+ and Otof C2C/C2C IHCs for voltage steps of 2 ms to 50 ms. Mean ΔCm is plotted against the duration of the depolarization to −10 mV (Δt). The inset shows the detail for Δt values between 2 ms and 10 ms. For the 2 ms and 5 ms depolarizations, five repetitions of the recordings were averaged, to increase the signal-to-noise ratio. The decrease in Ca2+-sensitivity of RRP vesicle fusion was evaluated by fitting the ΔCm versus Δt plots with a line for Δt between 2 and 10 ms in Otof C2C/+ IHCs and for Δt between 2 and 20 ms in Otof C2C/C2C IHCs. The Otof C2C/+ fit was plotted for durations greater than 10 ms, to illustrate the onset of the second component of release corresponding to the initiation of vesicle pool replenishment. (B3) We evaluated the coupling of voltage-gated Ca2+ channels to RRP vesicles, by setting the intracellular EGTA concentration to 5 mM in Otof C2C/+ IHCs (gray, n = 9) and in Otof C2C/C2C IHCs (light blue, n = 10). The data for an intracellular EGTA concentration of 0.5 mM are as in (B2). (C1) Protocol used to depolarize IHCs from −95 mV to −10 mV for 20 ms with different extracellular Ca2+ concentrations (top). Example Cm traces from P15-P18 Otof C2C/+ and Otof C2C/C2C IHCs for different extracellular Ca2+ concentrations (bottom). Each example Cm trace for a given genotype was obtained from a different IHC. (C2) ΔCm values plotted against the Ca2+ currents elicited at different extracellular Ca2+ concentrations ([Ca2+]e) in Otof C2C/+ and Otof C2C/C2C P15-P18 IHCs. Dashed lines show linear fits to the data. Data information: In (A2, B2–B3), data are presented as the mean ± SEM. ***p<0.001, ns not significant (two-way-ANOVA). In (B2, inset), *p<0.05 (Student's t-test with Welch correction). In A1, example Ca2+ traces are corrected for linear leak conductance, leading to a subtraction of the sinusoidal signal. In (A1, B1, C1), the raw Cm traces are shown.


