
Figure 1. Body weight and motor performance.
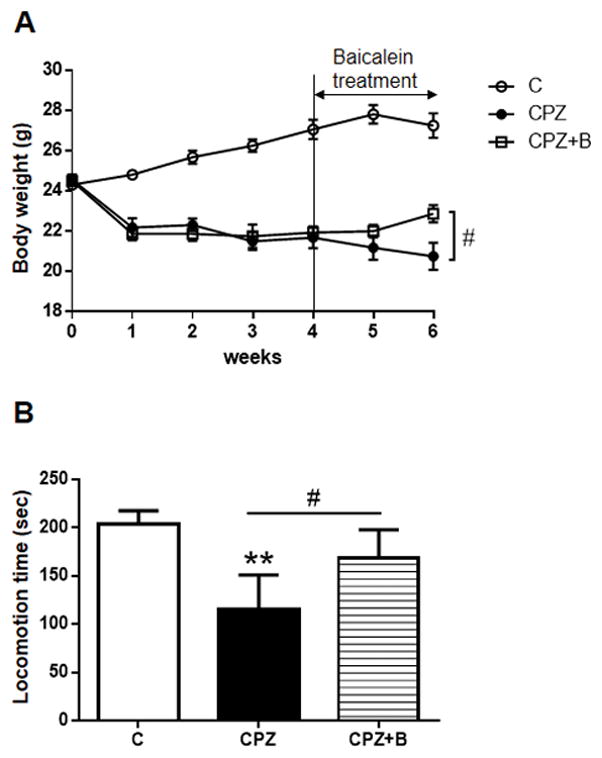
Body weight was measured weekly after 6 weeks of cuprizone (CPZ) exposure (A). Data are mean ± SEM, n = 8 animals. Statistical analysis was performed using one-way ANOVA followed by post-hoc Mann-Whitney U-test (#p < 0.05 vs. CPZ). Motor performance on the rotarod (B). Mice were assessed for locomotion time during a period of 300 s. Data are mean ± SEM, n = 8–9 animals. Statistical analysis was performed using Mann-Whitney U-test (**P < 0.01 vs. Control, #p < 0.05 vs. CPZ).