
Figure 2. Black Gold II staining of myelin and gene expression levels of CNP and MBP.
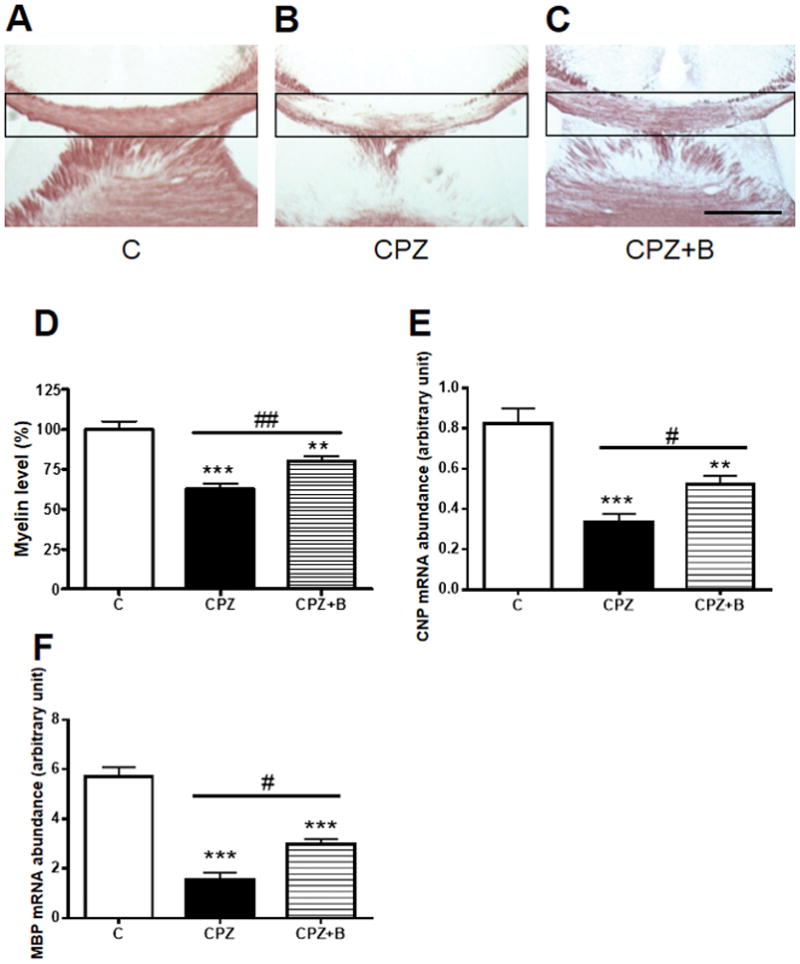
Representative photomicrographs of coronal brain sections at the level of the fimbria demonstrate progressive demyelination of the corpus callosum after 6 weeks of cuprizone (CPZ) exposure. Black-Gold II staining of control (A), CPZ (B), CPZ + Baicalein (C). Myelin densities in the corpus callosum (D) were compared with controls and expressed as a percentage of the control value using the ImageJ analysis program. Data are mean ± SEM, n = 7. Scale bar for = 500 μm. Gene expression of CNP (E) and MBP (F) relative to PGK1, as determined by real-time PCR in the corpus callosum after 6 weeks of cuprizone exposure. Data are mean ± SEM, n = 5 (***p < 0.001, **p < 0.01 vs. controls; ##p < 0.01, #p < 0.05 vs. CPZ).