
Figure 3. Immunofluorescence of microglial and astrocyte markers, and gene expression levels of glial markers.
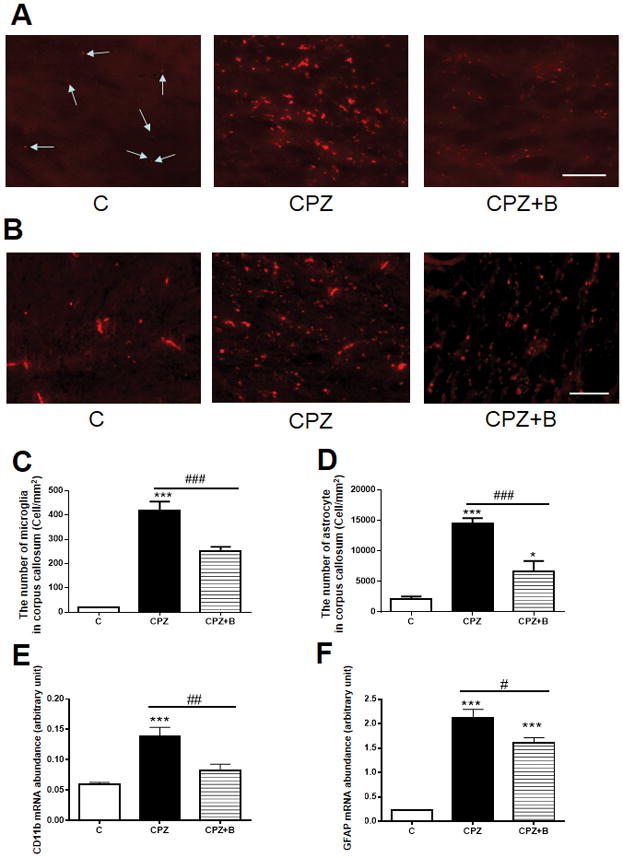
Immunofluorescence staining of microglial marker (Iba-1) (A) and astrocyte marker (GFAP) (B) in the corpus callosum. Arrows indicate Iba-1-positive rest microglia in (A). The number of microglia in the corpus callosum (C). Data are means ± SEM, n = 4 (***p < 0.001 vs. control; ###p < 0.001 vs. CPZ). The number of astrocyte in the corpus callosum (D) Data are means ± SEM, n = 5 (***p < 0.001, *p <0.05 vs. control; ###p < 0.001 vs. CPZ). Statistical analysis was performed using one-way ANOVA followed by post-hoc Newman-Keuls tests. Scale bars = 50 μm. Gene expression of microglial marker CD11b (E) and astrocytic marker GFAP (F) relative to PGK1, as determined by real-time PCR in the corpus callosum after 6 weeks of cuprizone exposure. Data are means ± SEM, n = 5 (***p < 0.001, **p < 0.01 vs. control; ###p < 0.001, #p < 0.05 vs. CPZ). Statistical analysis was performed using one-way ANOVA followed by post-hoc Newman-Keuls tests.