
Figure 4. Gene expression levels of pro-inflammatory cytokines and nitric oxide synthases.
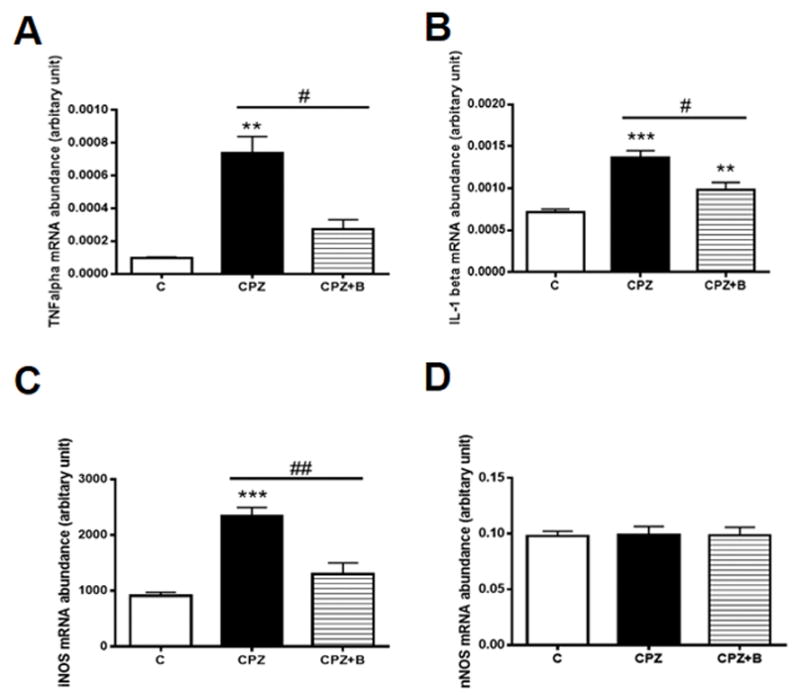
Gene expression of TNFα (A), IL-1β (B), iNOS (C) and nNOS (D) relative to PGK1, as determined by real-time PCR in the corpus callosum after 6 weeks of cuprizone exposure. Data are means ± SEM, n = 5 (***p < 0.001, **p < 0.01 vs. control; ##p < 0.01, #p < 0.05 vs. CPZ). Statistical analysis was performed using one-way ANOVA followed by post-hoc Newman-Keuls tests.