
Fig. 3.
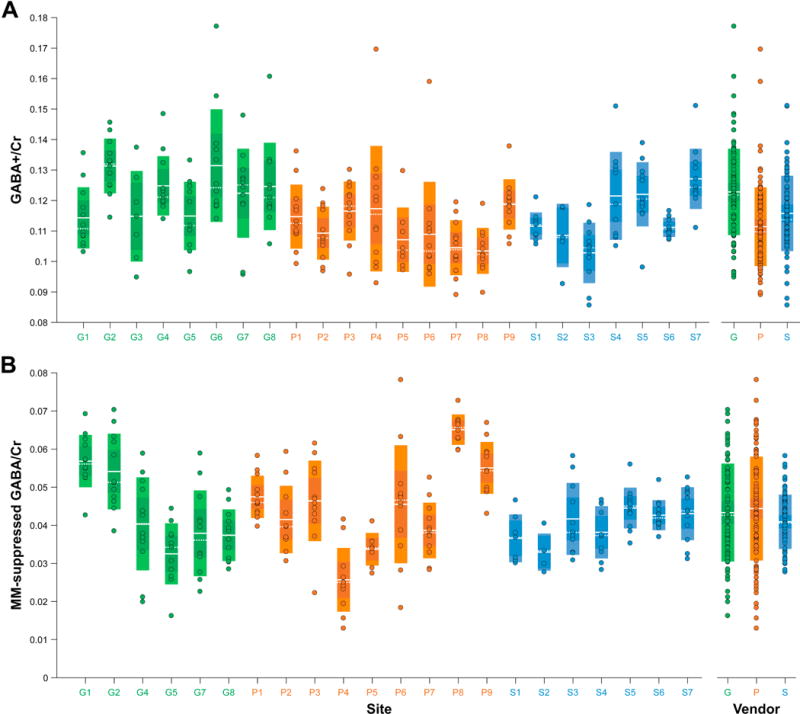
(A) GABA+/Cr and (B) MM-suppressed GABA/Cr measurements, displayed by site and by vendor. The boxes shaded with lighter colors represent ±1 SD and the darker boxes represent the 95% CI. The solid white lines denote the mean, while the dashed white lines denote the median. Sites are colored by vendor (GE sites in green, Philips sites in orange, Siemens sites in blue).