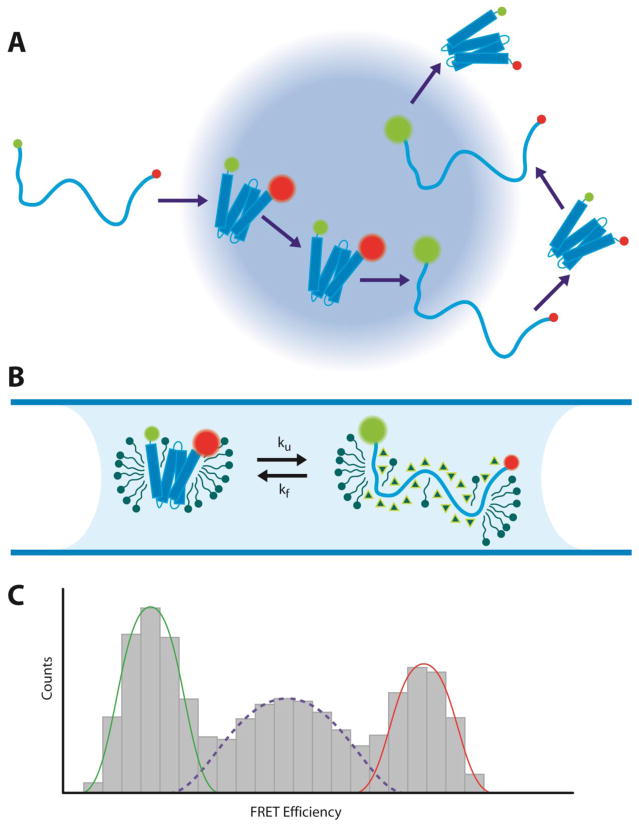
Figure 2. Single-molecule FRET measurements of membrane protein folding.
(A) Example trajectory of a membrane protein undergoing folding and unfolding transitions through the confocal excitation volume. (B) Mistic in a micelle environment unfolded with urea (triangles). (C) Histogram of FRET efficiencies from recorded single-molecule bursts. Low FRET efficiencies represent the fraction of unfolded molecules (green), while high FRET efficiencies represent folded molecules (red). The mid-range FRET efficiencies arise from molecules undergoing fast folding and unfolding transitions during single bursts, reflecting the unfolding and folding rates, ku and kf.

