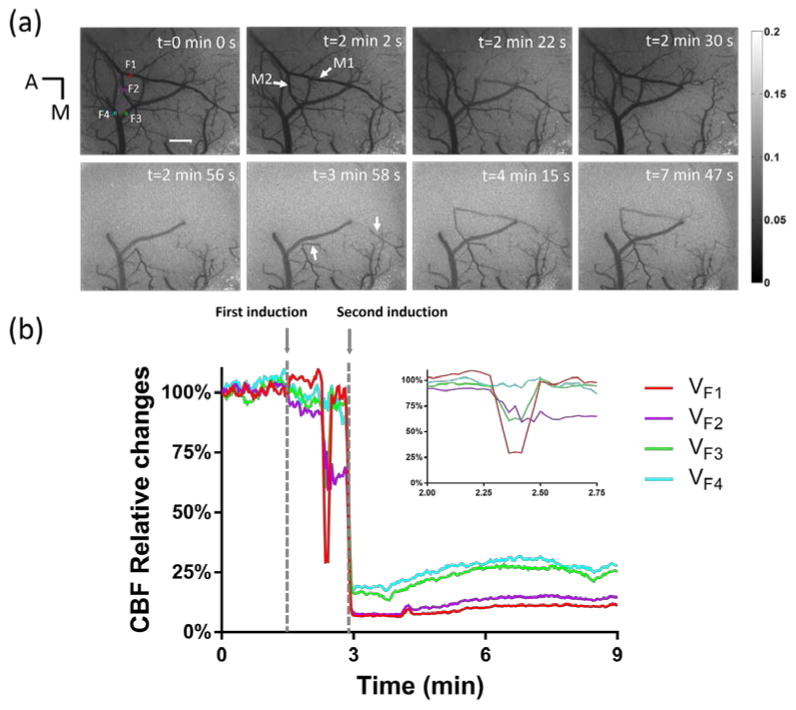
Fig. 2.
CBF changes before, during and after dMCAO induction. (a) LSI images at different time points. In Fig. 2(a) -0 min, four squares labeled with red, magenta, green and blue indicates area F1 and F2 on artery, and F3 and F4 on vein. A, anterior; M, median. (b) The relative CBF changes in areas F1, F2, F3 and F4. The enlarged image shows the detailed change of relative CBF changes between t = 2 min 0 sec and t = 2 min 45 sec. Scale bar: 500 μm.

