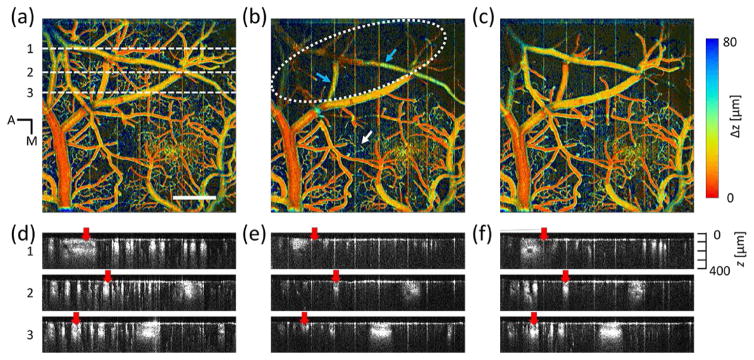
Fig. 3.
Depth-coded OCT angiograph in a mouse cortex. (a) Before the induction of dMCAO. (b) Immediately after the MCA occlusion. (c) After the reperfusion of MCA branch. Scale bar: 500 μm. (d), (e) and (f): OCTA B-scan images taken from (a), (b) and (c) at selected locations indicated by white dashed line in (a).

