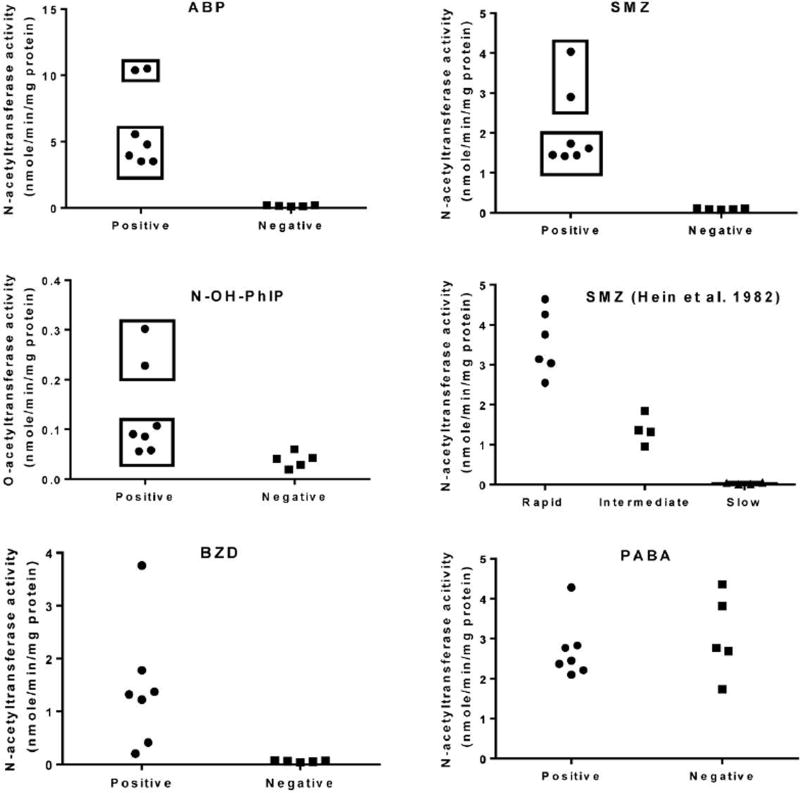
Figure 3.
Scatter plots of ABP, SMZ, BZD and PABA N-acetyltransferase activities in liver cytosols of rabbits positive and negative for presence of the NAT2 gene (the data is presented as Mean ± SEM in Figure 2). Rabbit liver cytosolic SMZ N-acetyltransferase activities from homozygous rapid, heterozygous intermediate, and homozygous slow acetylators redrawn from a previous publication (Hein et al., 1982) also are illustrated for comparison. Based on this comparison, the top rectangles illustrate N-acetyltransferase activities for two rabbits that likely possess two copies of the NAT2 gene whereas the bottom rectangles illustrate N-acetyltransferase activities for five rabbits that likely possess a single copy of the NAT2 gene.

