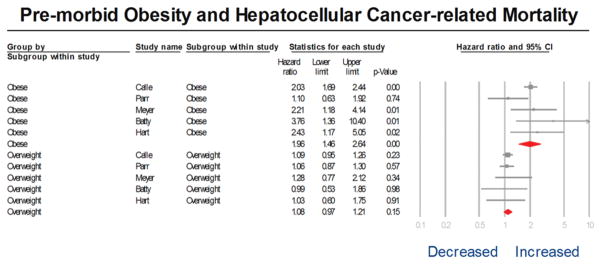
Figure 2.
Forest plot of adjusted relative risks of obese and overweight categories of body mass index (BMI) category vs. normal weight, with HCC-related mortality.
The size of each box indicates the relative weight of each study in the meta-analysis. Horizontal lines represent the 95% confidence intervals (CIs).

