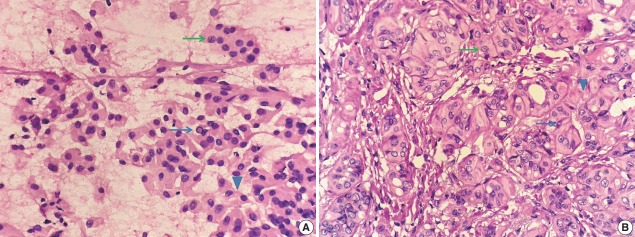
Fig. 1.
(A) Cytology of hyalinizing trabecular tumor. The thin green arrow shows nuclear groove, and the thin blue arrow shows pseudoinclusion. The arrowhead shows filament-like hyalinizing material between the tumor cells. (B) Histology of hyalinizing trabecular tumor. The thin green arrow shows nuclear groove, and the thin blue arrow shows pseudoinclusion. The arrowhead shows hyalinizing material around the cell nests.

