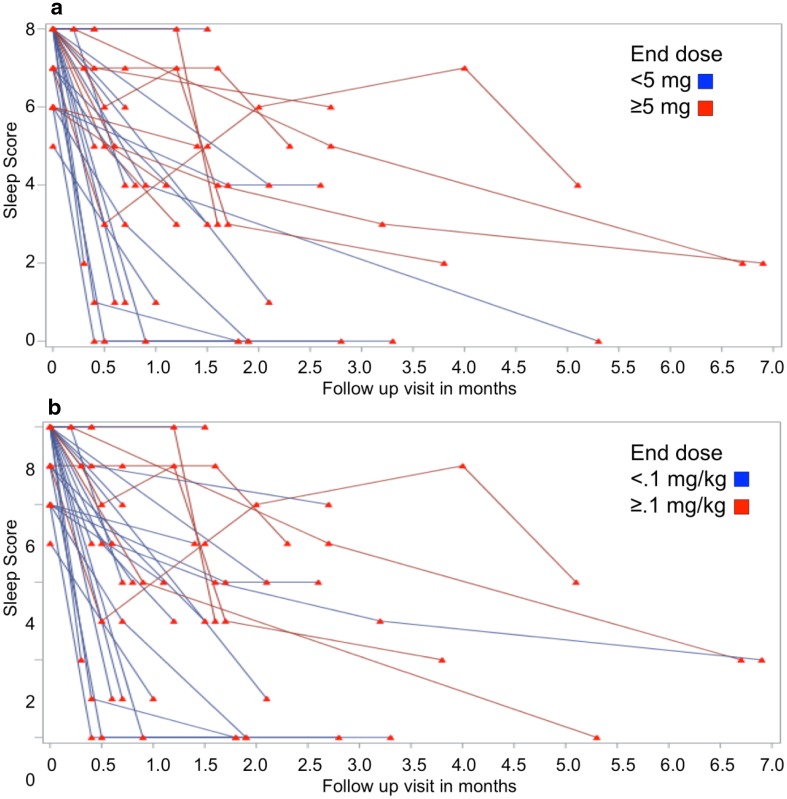
Fig. 1.
Plots of sleep scores in prazosin-treated patients. Each line represents the reported sleep symptom score (range 0–8) for individual patients. Decreases represent symptomatic improvement. a Rate of improvement based on final absolute dose, b categorization based on final dose in mg/kg body weight

