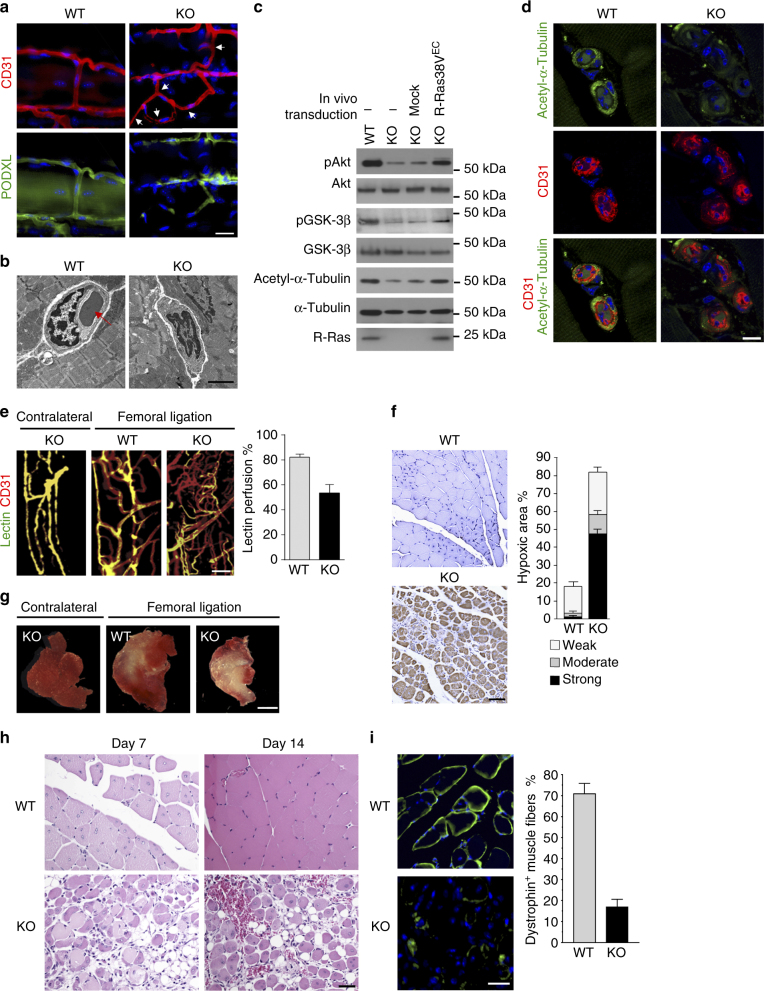
Fig. 4.
Defective EC lumenogenesis and impaired muscle reperfusion in R-Ras deficiency. Hindlimb ischemia was induced in wild-type (WT) and R-Ras KO (KO) mice by left femoral artery ligation, and GC muscles were analyzed 14 days later. a Immunofluorescence of CD31 and PODXL to identify lumenized vessels. Arrows indicate lumen-less vessels formed in the ischemic GC muscles of R-Ras KO mice. b Transmission electron microscopy confirmed the absence of lumen structures in numerous R-Ras KO vessels developed in response to ischemia. Muscle were sectioned perpendicular to the muscle fibers. Arrow, a circulating erythrocyte indicates normal lumen formation in a wild-type vessel. c Analyses of Akt (Ser473) and GSK-3β (Ser9) phosphorylation and α-tubulin acetylation in ECs isolated from ischemic GC muscles at day 14. ECs were also isolated from a separate set of R-Ras KO mice, which received lentivirus injection into the GC muscles for EC-specific expression of R-Ras38V (R-Ras38VEC) via in vivo transduction. d α-Tubulin acetylation in the endothelium of intramuscular vessels. e Lectin perfusion (green) into intramuscular vessels (red) was determined in the whole-mounted GC muscle fascicles. Yellow color (green/red double-staining) indicates blood perfused vessels. Lectin perfusion % = lectin+CD31+ area/total CD31+ area × 100, p < 0.01, n = 5. f Analysis of hypoxia in GC muscles at day 7 by hypoxyprobe-1™ staining (brown). Thresholds were set empirically for identifying the area with strong, moderate, or weak staining and presented as % of total muscle area examined. p = 8 × 10⁻⁶, n = 5. g Muscle viability was assessed at day 14 by staining the slices of unfixed GC muscles with 2,3,5-triphenyltetrazolium chloride, which stains viable tissues in red. The infarct areas are unstained (pale yellow/white). h H&E staining of GC muscle sections. i Dystrophin immunostaining (green) of GC muscle cross-sections to quantify functional muscle fibers. The number of dystrophin+ muscle fibers/total muscle fibers (%) was determined in non-necrotic area. p < 10−4, n = 5. Scale bars, 25 µm (a, h), 2 µm (b), 10 µm (d), 50 µm (f), 2 mm (g)

