Figure 1.
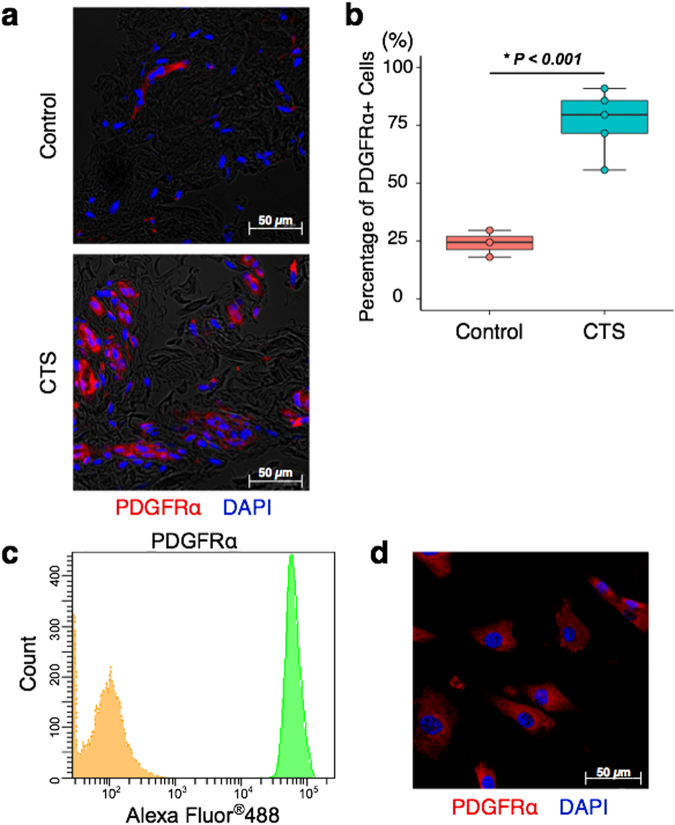
Identification of PDGFRα+ cells in SSCT. Representative image of PDGFRα+ cells identified in SSCT from CTS patients or normal controls (a). The percentage of PDGFRα+ cells in CTS SSCT (n = 5) were higher than that of control SSCT (n = 3) (b). Isolated SSCT cells from CTS expressed PDGFRα by flow cytometry (c) and immunocytochemistry (d). Boxes represent the interquartile range (IQR), lines within boxes represent the median, and lines outside boxes represent 1.5 times the IQR. Pairwise t test was used to assess the difference between control tissue and CTS tissue.

