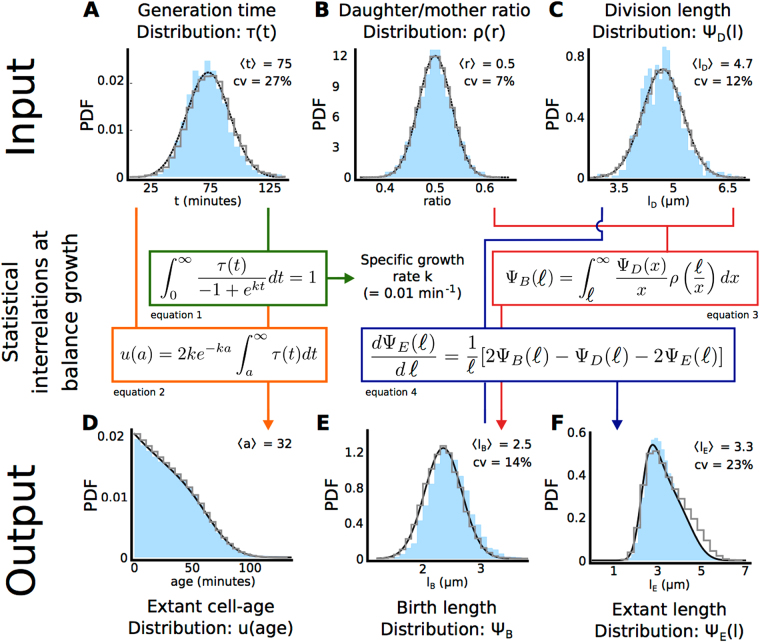
Figure 2.
Validation of relations between growth characteristics at balanced growth for B. subtilis.Shown are results comparing the microscopic growth theory relations derived by Collins & Richmond29, Powell28 and Painter & Marr27 and experimental single-cell growth data. In this figure we validate those relations. The probability distributions obtained from experimental data are shown in blue, the validated theoretical relations are shown in the coloured boxes (eqs 1–4), the predicted distributions are shown in black in (D), (E) and (F), and the results of our simulation algorithm (discussed in the final result section) are shown as grey histograms. In (A–C), black lines indicate fits. We calculated the population specific growth rate from the distribution of the generation times (A). The distribution of the cell ages (D; age is the time elapsed since birth) can be obtained from the generation time distribution (A) and the calculated specific growth rate of the population. Using the distribution of the division lengths (C) and the birth lengths (E), the distribution of cell length of all cells that exist at a particular moment in time can be obtained. The distribution of birth lengths (E) can, in turn, be obtained from the distribution of daughter-mother-volume ratios (B) and distribution of division lengths (C). Sample sizes: The sample sizes for the experimental data are 3637 extant cells, 2726 cells at birth and 1466 cells at division. Data for E. coli can be found in Fig. S5.

