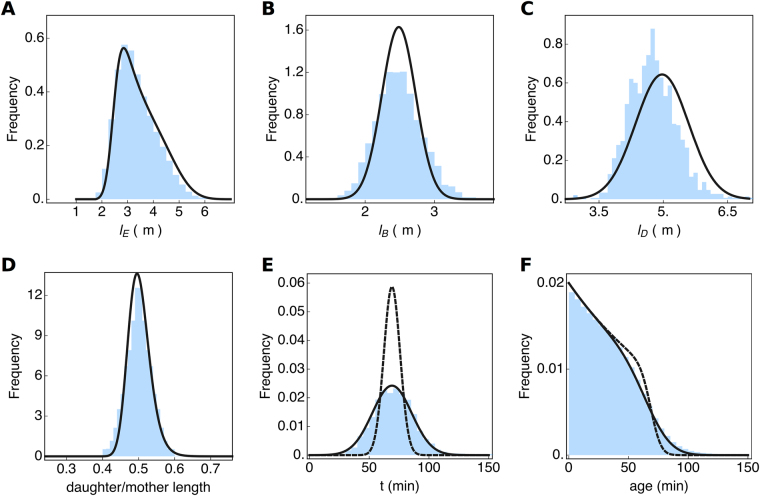
Figure 3.
Inference of probability distributions of single-cell growth characteristics from experimental data. In this figure, the blue histograms are the measured data (also shown in Fig. 2) and the black lines are inferred from the data. (A) Shows the extant cell-length distribution. The cell length distributions at birth (B) and division (C) were obtained by a fit of the Richmond & Collins relation (equation 4 of Fig. 2) to the extant cell length distribution, given the measured growth rate. The distribution of the ratio of the daughter cell length over the mother cell length (D). It was obtained from the distributions shown in (B) and (C), assuming a correlation between cell length at birth and division of 0.85. By assuming deterministic exponential growth, the distribution of generation times (E), was predicted from the length ratio distribution (D), without noise (dashed line) and with additional noise (full line). The distribution of cell ages (F) was calculated from the generation time distribution (E), using equation 2 from Fig. 2. The dashed line in (F) corresponds to the dashed generation time distribution in (E).

