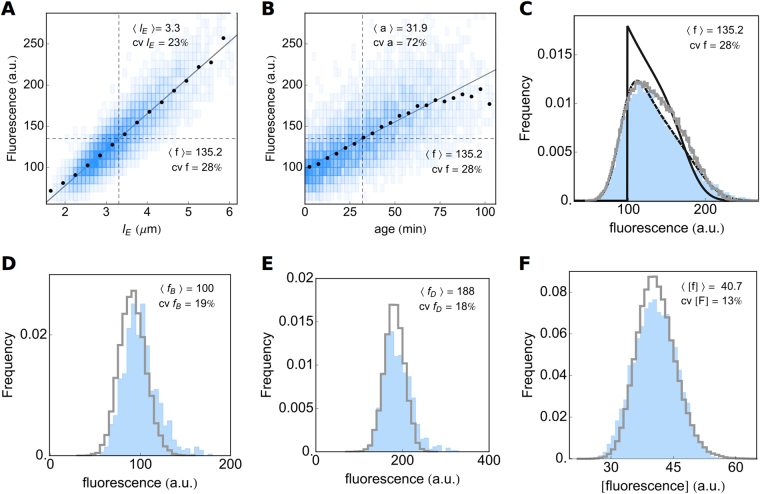
Figure 4.
Expression data of the reporter gene of B. subtilis. Fluorescent protein expression scales linearly with cell length (A) and cell age (B), but the correlation is weaker for age. By transforming the extant length (Fig. 2E) and age (Fig. 2D) distributions with the linear relation between length and fluorescence and between age and fluorescence, respectively, predictions of the fluorescent distribution can be made. The result clearly shows that cell length (C, dashed line) is a much better predictor of measured expression levels (C, blue area), than age (C, solid line). Also shown, is the distribution of expression levels obtained by stochastic simulation (C, gray line). Measured fluorescence distributions at (D) birth and (E) division (blue areas) are compared to stochastic simulations (gray lines). (F) Shows the comparison of the measured distribution of the fluorescence concentration of all extant cells (blue) and the simulations (gray line).

