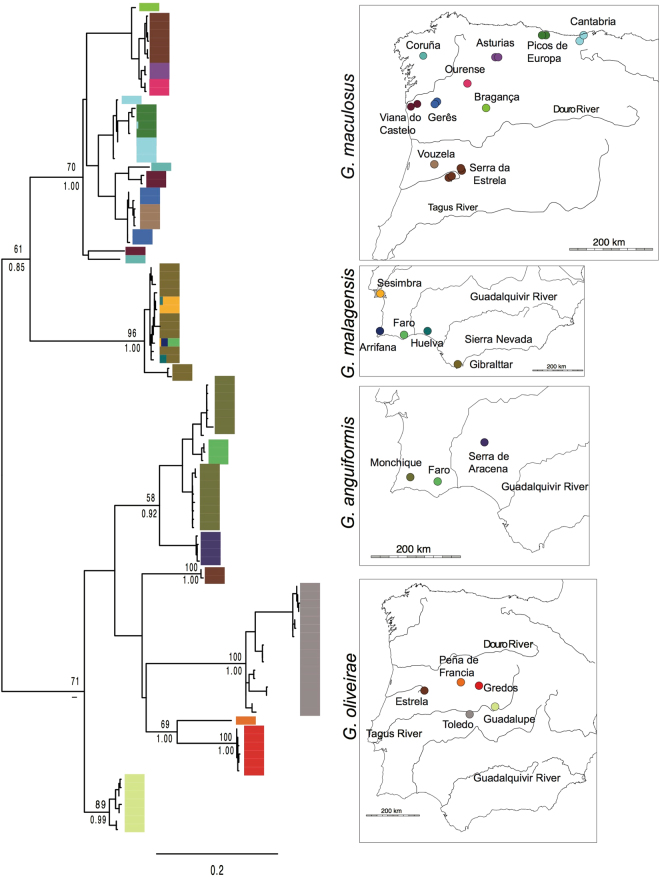
Figure 2.
Phylogenetic relationships of Geomalacus based on a maximum likelihood analysis of 100 unique COI haplotypes from 21 sampling sites. Tip labels are haplotype codes and the number of sequences of each haplotype. Numbers at the nodes represent ML bootstrap values (top) and Bayesian posterior probabilities (bottom) for major clades. Colour bars indicate geographic origins. Maps indicate sample locations for each Geomalacus species and the corresponding colour for the geographic origin of each sample. Phylogenetic tree generated by FigTree http://tree.bio.ed.ac.uk/software/figtree and edited in Adobe Illustrator CS6 (version 16.0.0) (http://www.adobe.com/products/illustrator.html). Maps generated using the worldHires (http://CRAN.R-project.org/package=mapdata) function implemented in R language (R Core Team (2015). R: A language and environment for statistical computing. R Foundation for Statistical Computing, Vienna, Austria. URL https://www.R-project.org/) (version 3.3.1) and edited in Adobe Illustrator CS6 (version 16.0.0) (http://www.adobe.com/products/illustrator.html).

