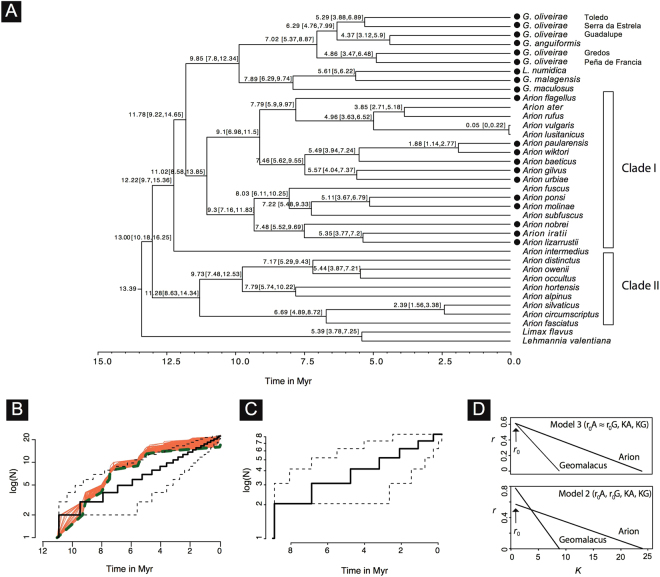
Figure 3.
(A) Beast maximum clade credibility chronogram showing main cladogenetic events within two genera of terrestrial slugs (Arion and Geomalacus) based on a fragment of the mitochondrial COI gene. Black circles represent Iberian endemic species. Clade I includes all 11 Iberian endemic Arion plus six non-endemic Arion species whereas clade II includes eight non-endemic Iberian Arion species. Age estimates in million years and corresponding 95% highest posterior density intervals (values in square brackets) are depicted; (B) Lineage through time plots (LTT) obtained from the empirical Beast timetree after pruning clade II that included non-endemic Arion only. Solid line represents the LTT plot. Orange lines represent the LTT plots from 1000 simulations using the CorSim approach taking into account missing species. Dashed green line represents the mean LTT plot and the area enclosed by stippled lines indicated the 95% CI for 1000 trees simulated under a pure-birth model; (C) Lineage through time plots (LTT) from the empirical Beast timetree including Geomalacus only. Solid line represents the LTT plot. The area enclosed by stippled lines indicated the 95% CI for 1000 trees simulated under a pure-birth mode. No CorSim simulations were performed because the genus was completely sampled; (D) Net diversification rate (r) vs. carrying-capacity (K) plots from the best-fit diversity dependent model on top (r 0A ≈ r 0G, KA, KG) and the second best-fit model on bottom (r 0A, r 0G, KA, KG). Tree figure generated by FigTree http://tree.bio.ed.ac.uk/software/figtree, LTT plots and r vs K produced in R (https://cran.r-project.org/ and edited in Adobe Illustrator CS6 (version 16.0.0) (http://www.adobe.com/products/illustrator.html).

