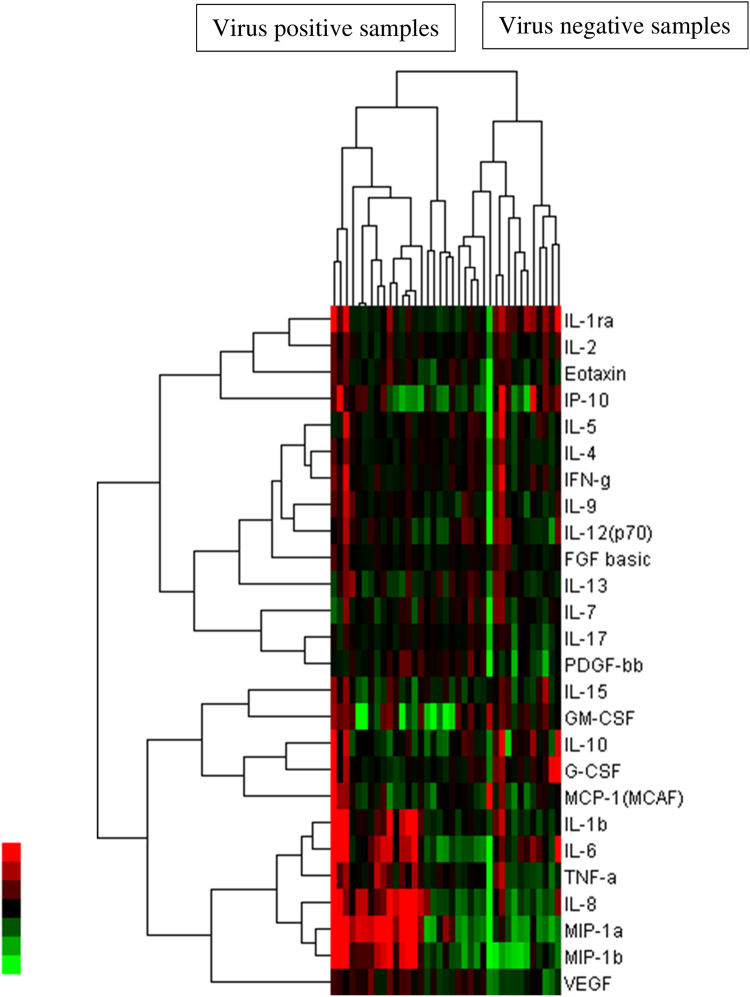
Figure 1.
Relative expression of cytokine levels. A heatmap showing relative expression of cytokine levels in virus-positive and virus-negative patients. Cytokine concentrations are expressed in different colours. The values for cytokines are in the rows and virus-status is in the columns. The dendogram describes how variables are related to each other according to cluster analysis. The height where two clusters are merged represents the distances of the two clusters. Color key on the left is showing green as the lowest and red as the highest concentration of cytokine.

