Fig. 1.
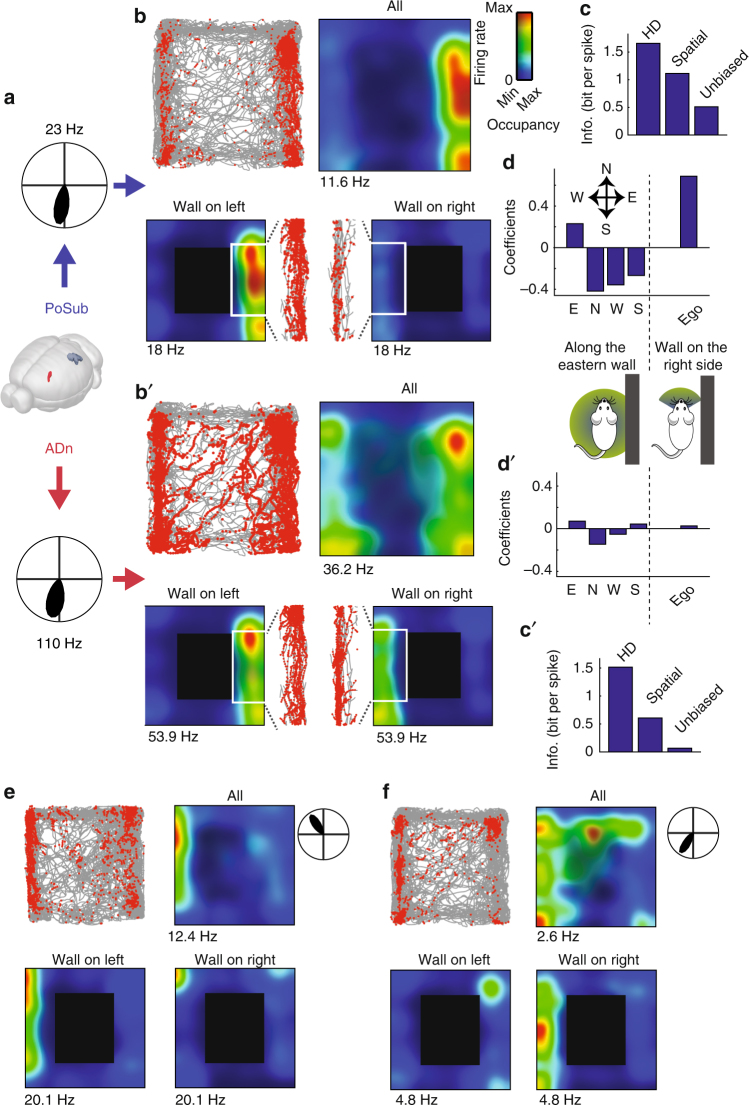
Spatial correlates of example HD neurons. a Two example HD neurons recorded simultaneously in the PoSub (top) and in the ADn (bottom). Polar plots indicate average firing rate in function of animal’s orientation. b Top left: position of the animal (gray) superimposed with location of the animal when the neuron spiked (red dots); top right, spatial tuning of the neuron where average firing rate at each location is represented as a colormap. Contrast displays the overall occupancy at each location. Bottom, place fields of the neuron during exploration along the borders when the walls are located on the left of the animal (left panel) or on the right (right panel). Inset show animal’s position and spike location in the two configuration during which a neuron governed only by its HD tuning curve is expected to fire. c HD, spatial and unbiased information per spike of the neuron shown in a (see Methods and Supplementary Fig. 1). d Top, regression coefficients of the generalized linear model applied to the binned spike train of the neuron displayed in a, consisting of walls (East, North, West or South) or relative wall position (Ego), both regression included expected instantaneous firing rate from HD tuning curve (see Supplementary Fig. 4). Bottom, schemas depicting the two types of behavioral variables used to regress the neuronal data on: left, specific border sensitivity (East, North, West or South) independently of animal’s head-direction; right, animal’s position relative to the closest wall (‘all on the right’ or ‘wall on the left’) within a ± 60° range of head direction. b′–d′ Same as b–d for a ADn HD neuron. e–f Additional examples of two wall-modulated HD neurons in the PoSub. Brain displayed in a © 2015 Allen Institute for Brain Science. Brain Explorer. http://mouse.brain-map.org/static/brainexplorer

