Fig. 2.
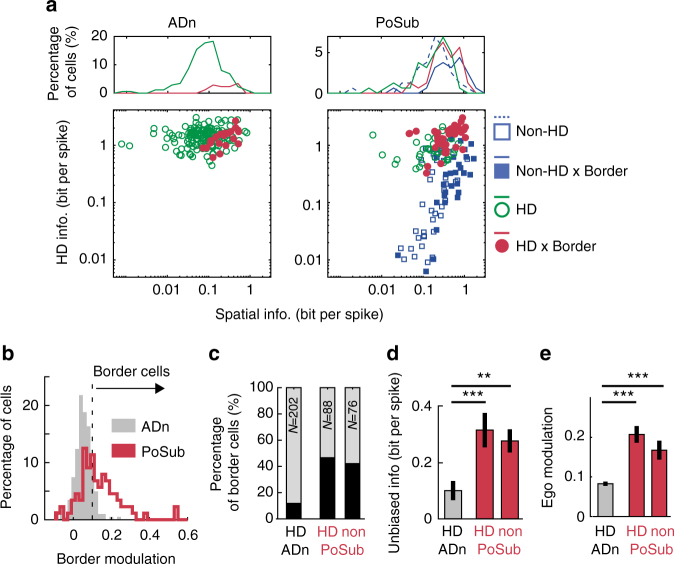
Distribution of behavioral correlates in ADn and PoSub cell populations. a Bottom, the amount of head-direction vs. unbiased spatial information is shown for all the HD neurons in the ADn (left) and HD and non-HD putative pyramidal neurons in the PoSub (right). HD cells are shown in green, border-modulated neurons as filled markers and HD-by-border as red filled markers. Top histograms display the marginal distribution of unbiased spatial information within each category: green for non-border HD neurons, red for HD-by-border neurons, dashed blue line for non-border, non-HD pyramidal neurons, plain blue for pyramidal border, non-HD neurons. b Distribution of border modulation coefficients for HD cells in the ADn (gray bars) and the PoSub (red line). The vertical dashed line indicates the threshold that was chosen to distinguish between border and non-border modulated neurons. c Proportion of border-modulated neurons for all cell categories (black bars). Numbers indicate the total number of neurons in each category (‘non’ stands for ‘non-HD’). d Average (±s.e.m.) unbiased information in ADn HD neurons and PoSub HD and non-HD pyramidal neurons. e Same as d for egocentric modulation of neurons. **p < 0.01, ***p < 0.001

