Figure 5.
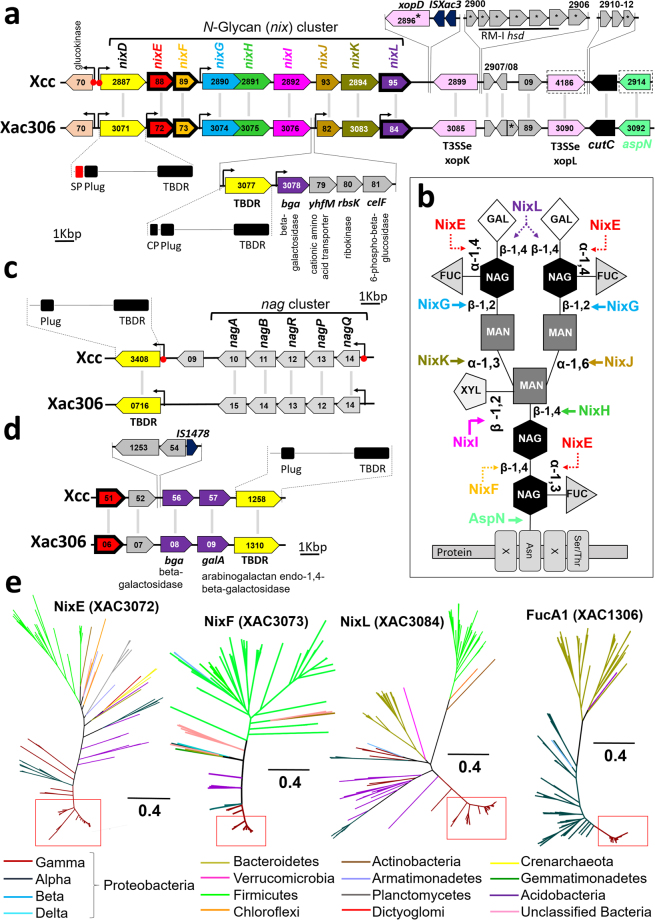
Functional and syntenic analysis of genes associated with N-glycans degradation. (a) Composition and structural organization of nix genes in Xcc and Xac306. Each of the individual colors of genes in the cluster corresponds to the respective site of catalysis shown for the N-glycan metabolism in Fig. 5b (adapted from Boulanger, et al.48). Three protein families from our study are encoded by genes included in this cluster and are circled in bold (NixE, NixF, and NixL). For Xac306 a set of genes with correlated functions between nixI and nixJ are highlighted. The region downstream of the cluster has structural variations among the investigated organisms. (b) Composition of an N-glycan with the respective enzymes associated with its degradation. The colors of the proteins identifiers and their catalysis follow the color pattern shown in Fig. 5a and d. The dotted lines refer to the catalysis of the phytopathogen-enriched proteins. (c) Structural organization of nag genes. (d) Composition and structural organization of putative genes associated with N-glycan degradation in Xcc and Xac306. The gene coding the FucA1 family specific to phytopathogens are circled in bold. (e) NixE, NixF, NixL, and FucA1 phylogenies. The red squares highlight positions occupied by Xanthomonas and Xylella. The clade composition of NixE, NixF, and NixL are similar among each other and distinct when compared to FucA1 because these enzymes encoded genes arranged in the same genomic region that compose the nix cluster. Check for details at Figs S12–S15 – Supporting Information.

