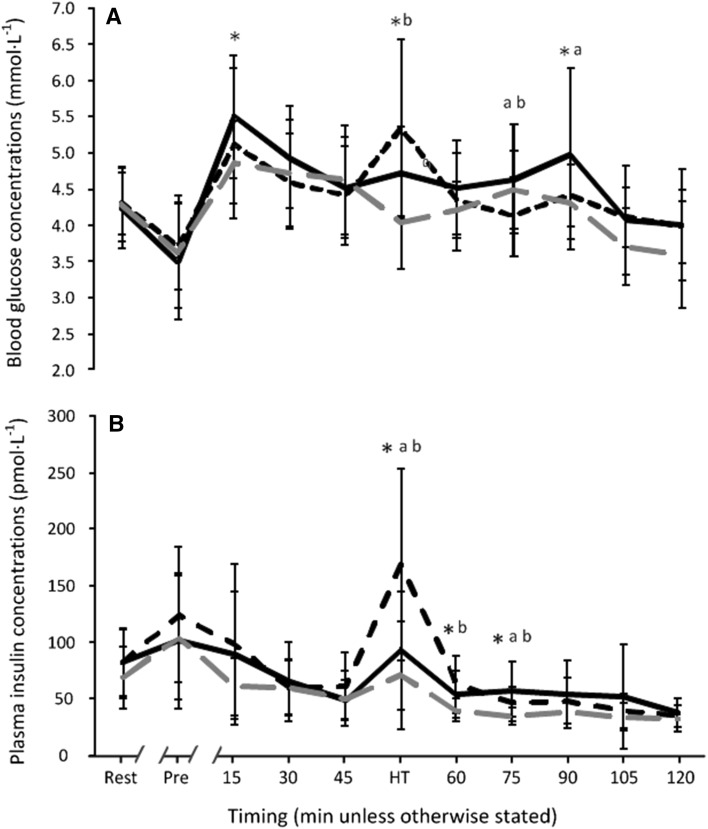
Fig. 2.
Blood glucose (a) and plasma insulin (b) concentrations throughout the PSE (black solid line), MDX (black dashed line) and PLA (grey dashed line) trials (n = 22, data are presented as mean ± SD). *Significant difference between PSE and PLA at corresponding time-point; a represents significant difference between PSE and MDX at corresponding time-point; b represents significant difference between MDX and PLA at corresponding time-point

