Fig. 2.
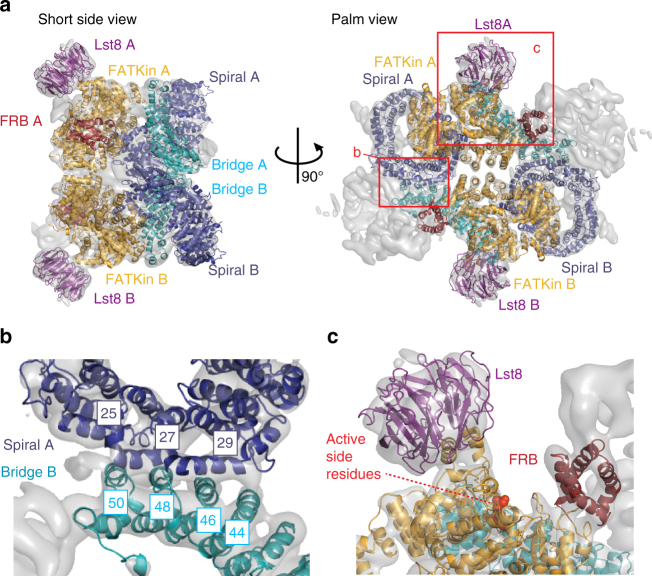
Fitting of S. cerevisiae Tor2-Lst8 dimer model into the TORC2 map. a Tor2-Lst8 model fitted into the cryo-EM density of TORC2 (transparent grey) shown from the short side view (left) and the palm view (right). The protomers are labelled A and B. Red boxes highlight the areas shown in a close-up view in b, c. b Close-up of the dimer interface formed by the spiral (purple) of one Tor2 molecule and the bridge (cyan) of the second Tor2. Helices Nα25, Nα27 and Nα29 (spiral) and Nα44, Nα46, Nα48 and Nα50 (bridge) are involved in interface contacts. c Close-up of the Tor2 active site. Active site residues of the kinase are highlighted as red spheres. The FRB domain is depicted in dark red, the FAT/kinase domain (FATKin) in orange-yellow and Lst8 in purple

