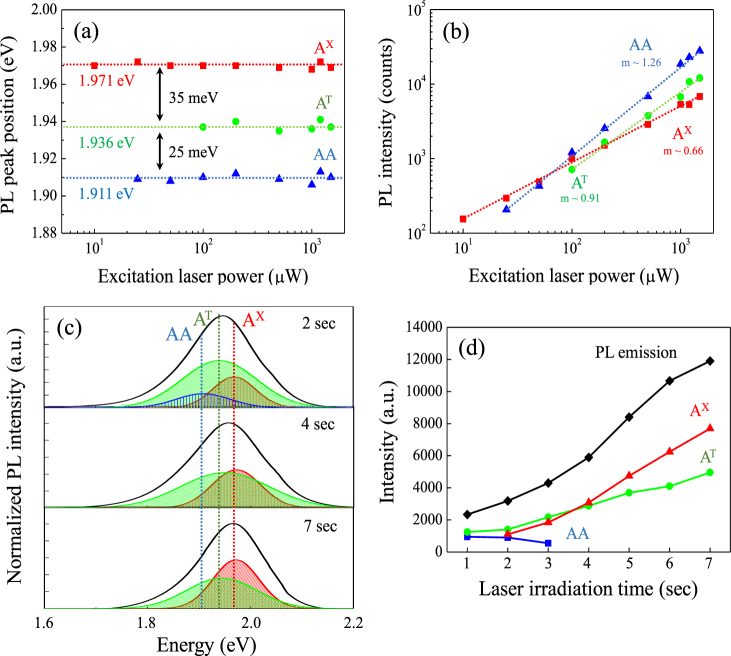
Figure 5.
Laser power dependent PL (a) peak positions and (b) intensities of exciton complexes from the laser irradiated single-layer WS2. The m values indicate logarithmic values of each slope, and the dashed lines in (a) and (b) are guides for the eye to visualize. (c) Laser irradiation time dependent photoluminescence spectra and the deconvoluted excitation complexes for 2, 4, and 7 seconds laser irradiation and (d) the overall peak position of exciton complexes with laser irradiation time for1–7 seconds.

