
Figure 7.
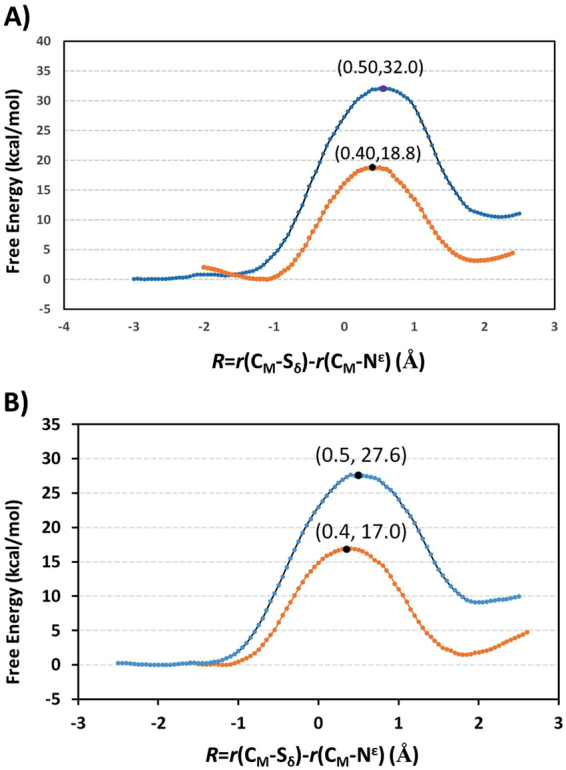
Free energy (potential of mean force) profiles for the methylation reactions in the enzymes as a function of the reaction coordinate [R = r(CM···Sδ) − r(CM···Nζ)]. (A) The free energy profile for methylation of lysine in SETD7: orange line with a free energy barrier of 18.8 kcal mol−1 and the location of the transition state is at around 0.4. The free energy profile for methylation of ornithine in SETD7: blue line with a free energy barrier of 32 kcal mol−1. (B) The free energy profile for methylation of lysine in GLP: orange line with a free energy barrier of 17.0 kcal mol−1. The free energy profile for methylation of ornithine in GLP: blue line with a free energy barrier of 27.6 kcal mol−1.