
Figure 1.
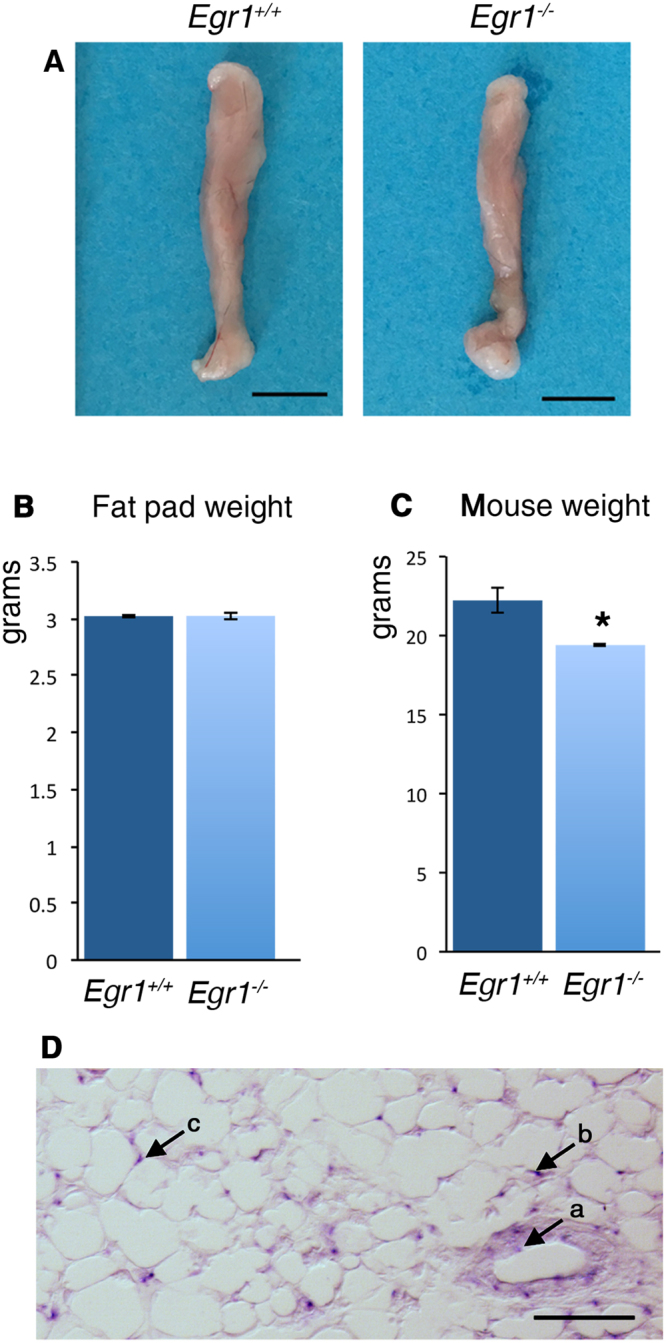
Phenotype of inguinal subcutaneous white adipose tissue in 4-month-old Egr1 −/− mice. (A) Pictures of fat pads (SC-WAT) from 4-month-old Egr1 +/+ and Egr1 −/− mice. Scale bars: 5 mm. (B) Weight in grams of SC-WAT of 4-month-old Egr1 +/+ and Egr1 −/− mice. The graph shows mean ± standard deviations of 6 Egr1 +/+ fat pads and 8 Egr1 −/− fat pads. (C) Weight in grams of 4-month-old wild-type and mutant mice. The graph shows means ± standard deviations of 4 Egr1 +/+ and 4 Egr1 −/− mice. The p-value was obtained using the Mann-Whitney test. Asterisk indicates the p-value *P < 0.05. (D) SC-WAT of 1-month-old mice was longitudinally sectioned. 6 µm sections were hybridized with the DIG-labeled antisense probe for Egr1 (blue). Arrow a points Egr1 expression in blood vessels. Arrows b and c indicate Egr1 expression in white adipocytes. Scale bars: 50 µm.