Figure 2.
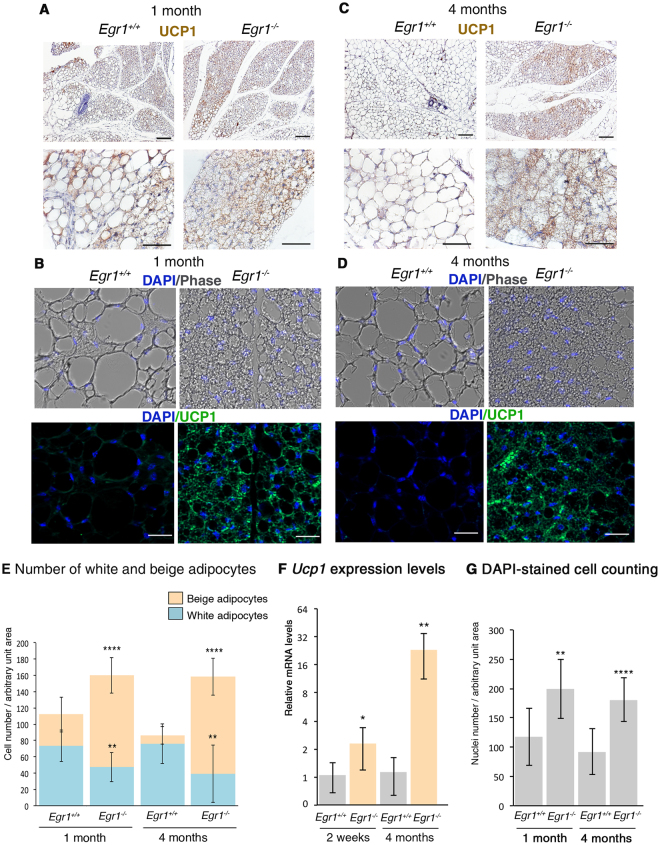
Egr1 leads to inguinal subcutaneous white adipose tissue browning in postnatal and 4 month-old mice. (A–D) Sections of SC-WAT of 1-month-old (A,B) and 4-month-old (C,D) Egr1 +/+ and Egr1 −/− mice were immuno-stained with UCP1 antibody. Nuclei were visualized with hematoxilin (A,C) or DAPI (B,D). (B,D) upper and lower panels are Dapi/Phase and UCP1/DAPI views of the same field. Scale bars: (A,C) lower magnification 100 µm, higher magnification 50 µm; (B,D) 25 µm. (E) White and beige adipocyte number was counted in arbitrary unit areas of transverse sections of SC-WAT of 1-month-old Egr1+/+ (N = 10) and Egr1 −/− (N = 11) mice and 4-month-old Egr1 +/+ (N = 13) and Egr1 −/− (N = 14) mice. Graphs show means of counts generated from 10 to 14 sections for each sample ± standard deviations. Asterisks indicate the p-values obtained using the Mann-Whitney test, comparing beige or white adipocyte number between mutant and control mice **P < 0.01, ****P < 0.0001. (F) RT-qPCR analysis of expression levels for beige adipocyte differentiation marker Ucp1 in SC-WAT of 2-week-old and 4-month-old Egr1 −/− mice compared to Egr1 +/+ mice. Graphs show means ± standard deviations of 5 samples from 2-week-old Egr1 +/+ and Egr1 −/− mice, 6 samples from 4-month-old wild-type mice and 5 samples from 4-month-old Egr1 −/− mice. The Ucp1 mRNA levels of control (Egr1 +/+) SC-WAT were normalized to 1. The relative mRNA levels were calculated using the 2−ΔΔCt method. The p-values were obtained using the Mann-Withney test. Asterisks indicate the p-values *p < 0.05, **p < 0.01. (G) Cell number in SC-WAT in Egr1 +/+ and Egr1 −/− mice. Number of nuclei (DAPI-positive cells) was counted in arbitrary unit areas of transverse sections of SC-WAT of 1 month-old Egr1 +/+ (N = 10) and Egr1 −/− (N = 11) mice and 4 month-old Egr1 +/+ (N = 13) and Egr1 −/− (N = 11) mice. Graphs show means of 10 to 13 sections for each sample ± standard deviations. Asterisks indicate the p-values obtained using the Mann-Whitney test, comparing beige or white adipocyte number between mutant and control mice **P < 0.01, **** P < 0.0001.

