Figure 4.
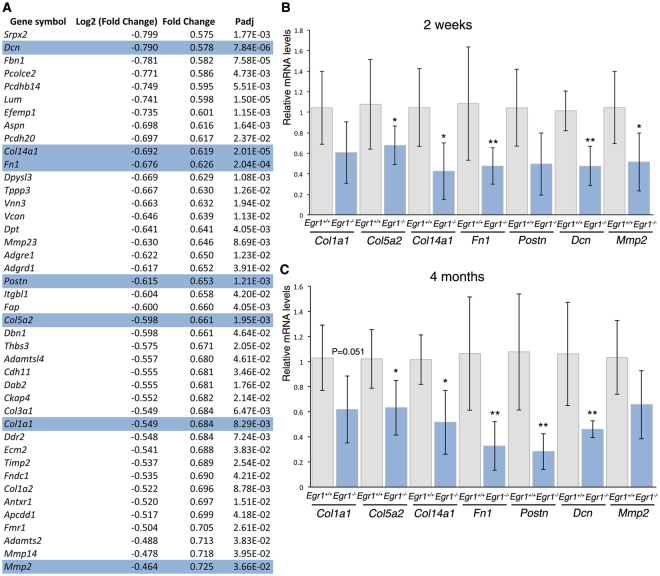
Transcriptomic analysis of the subcutaneous inguinal adipose tissue of postnatal Egr1 −/− versus Egr1 +/+ mice reveals downregulation of extracellular matrix genes. (A) List of downregulated extracellular matrix genes in 6 inguinal subcutaneous fat pads of 3 Egr1 −/− versus 3 Egr1 +/+ 2-week-old mice. (B,C) RT-qPCR analysis of gene expression levels for extracellular matrix genes, Col1a1, Col5a2, Col14a1, Fn1, Postn, Dcn and Mmp2, in SC-WAT of 2-week-old (B) and 4-month-old (C) Egr1 +/+ and Egr1 −/− mice. For each gene, the mRNA levels of control (Egr1 +/+) SC-WAT were normalized to 1. Graphs show means ± standard deviations of 5 samples from 2-week-old Egr1 +/+ mice and Egr1 −/− mice, 6 samples from 4-month-old Egr1 +/+ mice and 5 samples from Egr1 −/− mice. The relative mRNA levels were calculated using the 2−ΔΔCt method. The p-values were obtained using the Mann-Withney test. Asterisks indicate the p-values *p < 0.05, **p < 0.01.

