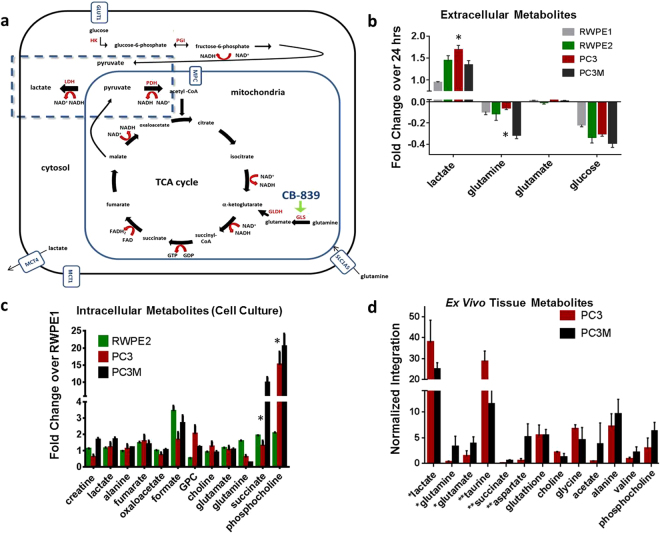
Figure 1.
Metabolic differences between PCa cell lines. In all experiments, metabolite values were determined by MRS and values were normalized as stated per experiment. Statistical significance indicated by an asterisk (*). (a) In this schematic, partial pathways of glycolysis, glutaminolysis, and the citric acid cycle are shown: red type is specific enzymes, red arrows depict the conversion of cofactors such as NAD+, blue type is transporters, and black type is specific metabolites. The dashed box highlights the production of lactate through lactate dehydrogenase (LDH). There are several steps between fructose-6-phosphate and the generation of two equivalences of pyruvate not shown. We were specifically focused on determining the differences in aerobic and anaerobic glycolytic metabolites in PCa cell lines. Abbreviations: HK (hexokinase), PGI (phosphoglucose isomerase), GLDH (glutamate dehydrogenase), GLS (glutaminase), MCT4 and MCT1 (monocarboxylic acid transporters), GLUT1 (glucose transporter), SLC1A5 (glutamine transporter), MPC (mitochondrial pyruvate carrier), MAE (malic enzyme). (b) To compare extracellular metabolite changes among cell lines, concentrations of metabolites within a 24-hour period were determined and changes over that period were graphed as shown. Positive bars are metabolites excreted into the media and negative bars are metabolites consumed by the cells over the 24-hour period (n = 5 samples per cell type). Glutamine uptake by PC3M cells was over three fold higher than that by PC3 cells (P < 0.0001). Lactate production by PC3 was 1.3 fold higher than that by PC3M (P < 0.0001). Statistical significance between metabolite levels was determined using two-way ANOVA with Tukey’s multiple comparisons. (c) To compare intracellular metabolite levels in cultured cells, metabolite concentrations were determined and the fold change compared to the indolent cell line (RWPE1) was plotted. The levels of metabolites succinate and phosphocholine (PCho) were significantly lower in PC3M cell lysates than in PC3 lysates (P < 0.0004). Statistical significance was determined by two-way ANOVA with Tukey’s multiple comparisons. (d) To compare levels of metabolites in ex vivo tumor tissues, PC3 and PC3M tumors were excised from mice and samples prepared for analysis (100 mg per sample, PC3 n = 4, PC3M n = 5). Levels of lactate and taurine were significantly higher in PC3 tumors than in PC3M tumors, while levels of aspartate, glutamate, glutamine and succinate were significantly higher in PC3M tumors than in PC3 tumors. Unpaired t-test using Holm-Sidak method was used to determine statistical significance (**P < 0.02, *P < 0.04).

