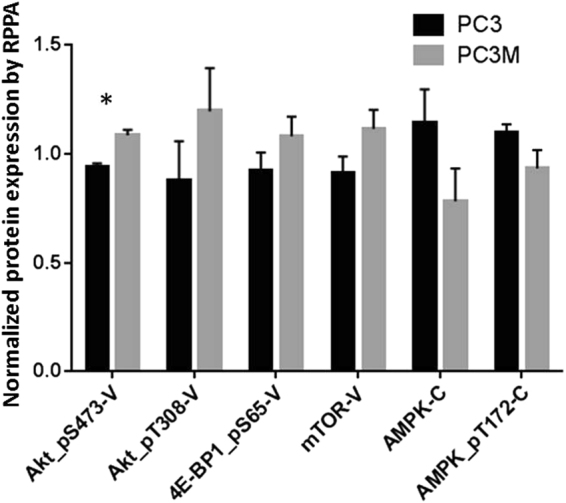
Figure 5.

Signaling pathway variation between PC3 and PC3M cells. Reverse-phase protein array (RPPA) analysis was used to identify differences in expression of various proteins in PC3 and PC3M cells (n = 3 samples per cell type). The x-axis labels represent selected proteins targeted by the antibodies used in the analysis; V is validated and C is course. The validated antibodies have been shown in multiple assays to target only the protein named and not to have off-target binding; course antibodies have off-target binding. PC3M cell lysates expressed higher levels of phosphorylated AKT (Akt-pS473, P < 0.01, unpaired t-test using Holm-Sidak method for multiple comparisons), 4E-BP1, and mTOR than PC3 cell lysates. Expression of AMPK and p-AMPK was higher in PC3 cell lysates.
