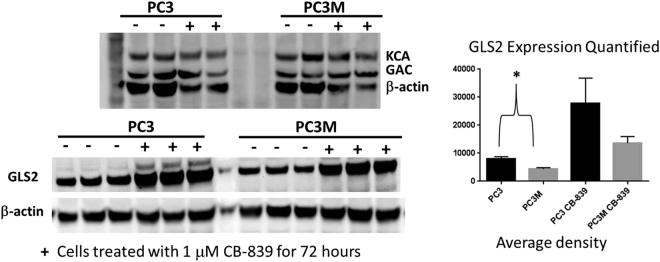
Figure 6.
Glutaminase protein expression in PC3 and PC3M cell lines before and after CB-839 treatment. PC3 and PC3M cells were treated (+) or not treated (−) with GLS1 inhibitor CB-839 (1 μM) and their expression of GLS1 and GLS2 proteins were determined by Western blot. Antibodies specific for GAC and KCA were utilized on two replicate samples, while GLS2 expression was determined on three replicates. PC3 cell lysates had higher levels of expression of GLS2 than PC3M cell lysates regardless of CB-839 treatment. The average density of bands in the GLS2 blots were determined by using ImageJ software. The statistical significance was determined by unpaired two-tailed t-test. The difference in GLS2 expression was significant in the untreated cells (P < 0.03) but because of high variability the difference was not significant in the drug-treated cells. Levels of GLS1 (GAC and KGA) were similar in all cell lysates. The full gels can be seen in the supplemental data.

