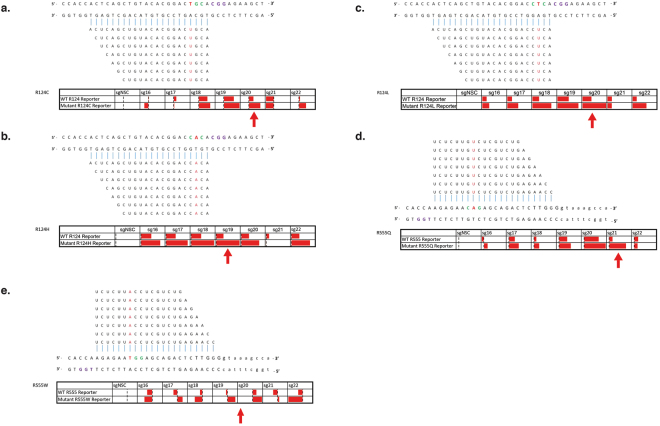
Figure 7.
Guide-length screen to determine the effect on specificity of a guide-specific system Heatmaps showing varying degrees of knockdown observed via a dual luciferase assay when guides ranging in different lengths are targeted to the wild-type and respective mutant sequence. Specificity bars show knockdown when normalised to the non-specific control, with 100% being maximal knockdown observed. Maximal allele-specificity observed for each mutation indicated with a red arrow.

