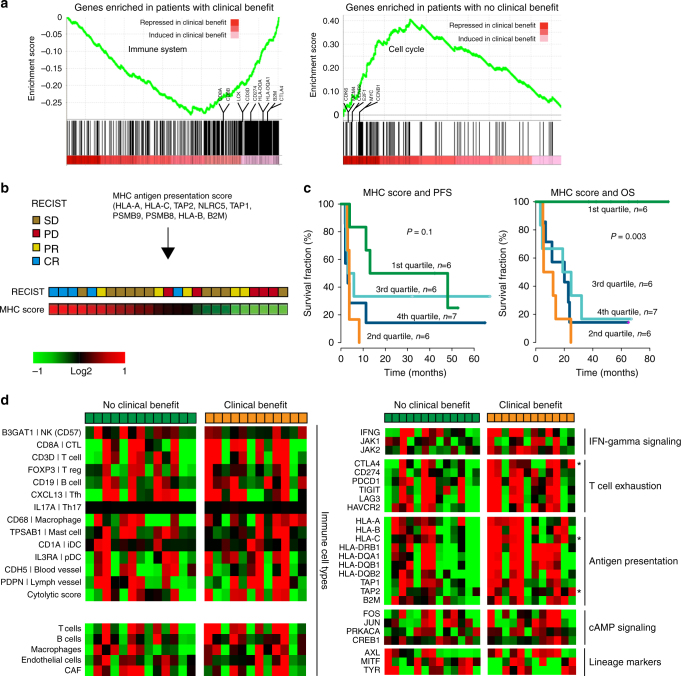
Fig. 4.
Expression of immune related genes and association to benefit from ACT in melanoma. a Enrichment plots from gene set enrichment analysis for the immune system and cell cycle pathways. b MHC class I expression score was constructed from indicated genes. c Progression-free and overall survival by MHC score quartile. P-values from Cox regression. d Expression of immune response related and melanoma lineage genes in patients with no clinical benefit (green) and with clinical benefit (orange). Signatures in the lower left panel (T and B cells, Macrophages, Endothelial cells, and CAF) are derived from publication by Tirosh et al.28. Star denotes genes with significant association to benefit from ACT (P < 0.05, t-test)

