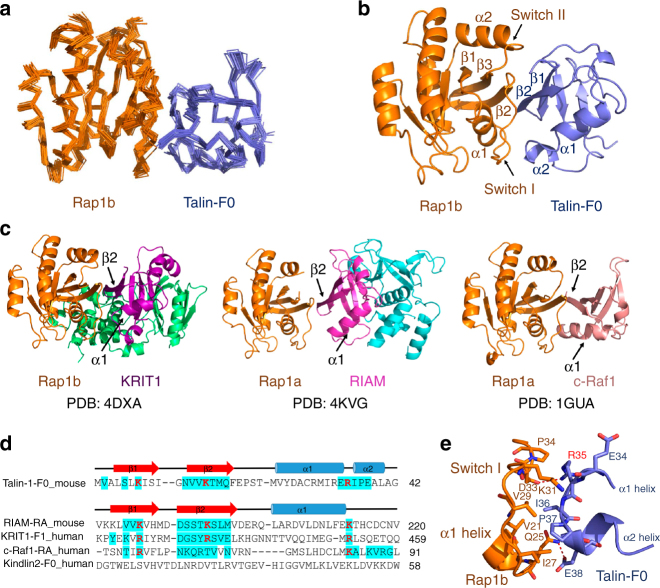
Fig. 4.
Solution structure of Rap1b/talin-F0 complex by NMR. a Superposition of 20 calculated Rap1b/talin-F0 complex structures with lowest energies (shown in ribbon representation). b Cartoon representation of the Rap1b/talin-F0 complex structure with the lowest energy. c Current solved complex structures of Rap1 and its effector proteins (shown in cartoon representation). d Structure-based sequence alignment of talin-F0 and RA domain containing Rap1b effector proteins or kindlin2-F0 (only binding interfaces were shown). Residues involved in the binding interface with a cutoff of 4 Å are highlighted in cyan. Conserved residues are colored in red. e Detailed interaction diagram between the α1 helix and switch I of Rap1b and the α2 helix of talin-F0. Hydrogen bond or salt bridge is represented by red dashed line

