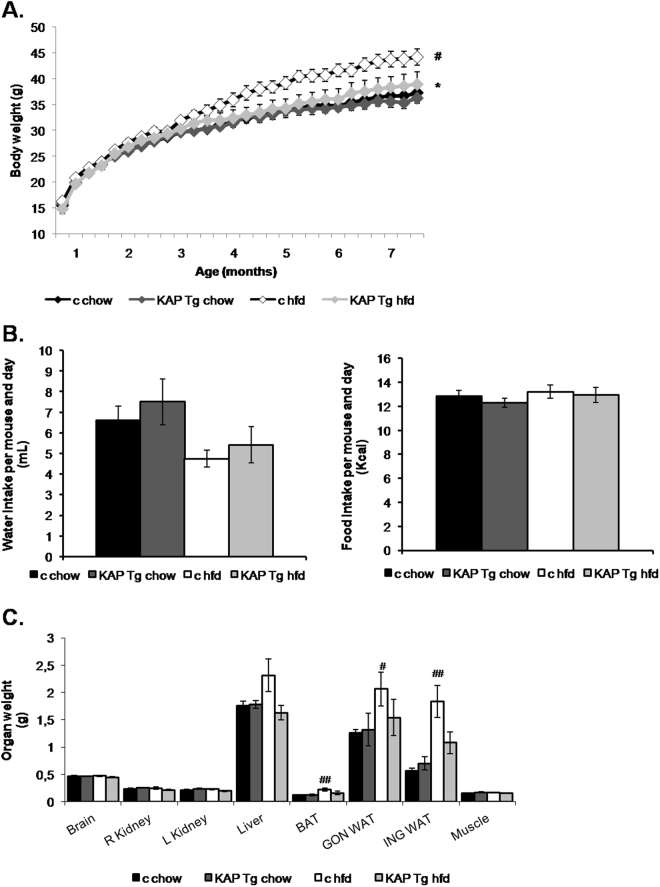
Figure 1.
Body weight control. (A) Weekly body weight of KAP Tg male mice (Tg) and control male littermates (c) fed on regular control diet (chow) or high fat diet (HFD). Results correspond to mean values from 3 independent set of experiments including n = 8 animals/group. Statistical analysis performed on area under the curve (AUC). *p < 0.05 between controls and Tg. #p < 0.05 between chow and HFD. (B) Weekly water (in grams) and food (kcal) intake. Results for this figure correspond to mean values from 1 experiment including control and Tg mice fed on regular chow or HFD (n = 8 per group). (C) Organ’s weight at the time of sacrifice at 7 months of life. Results correspond to mean values from 2 independent set of experiments including n = 8 animals/group. Significant differences between chow and HFD, ##p < 0.01. Error bars correspond to SEM.

