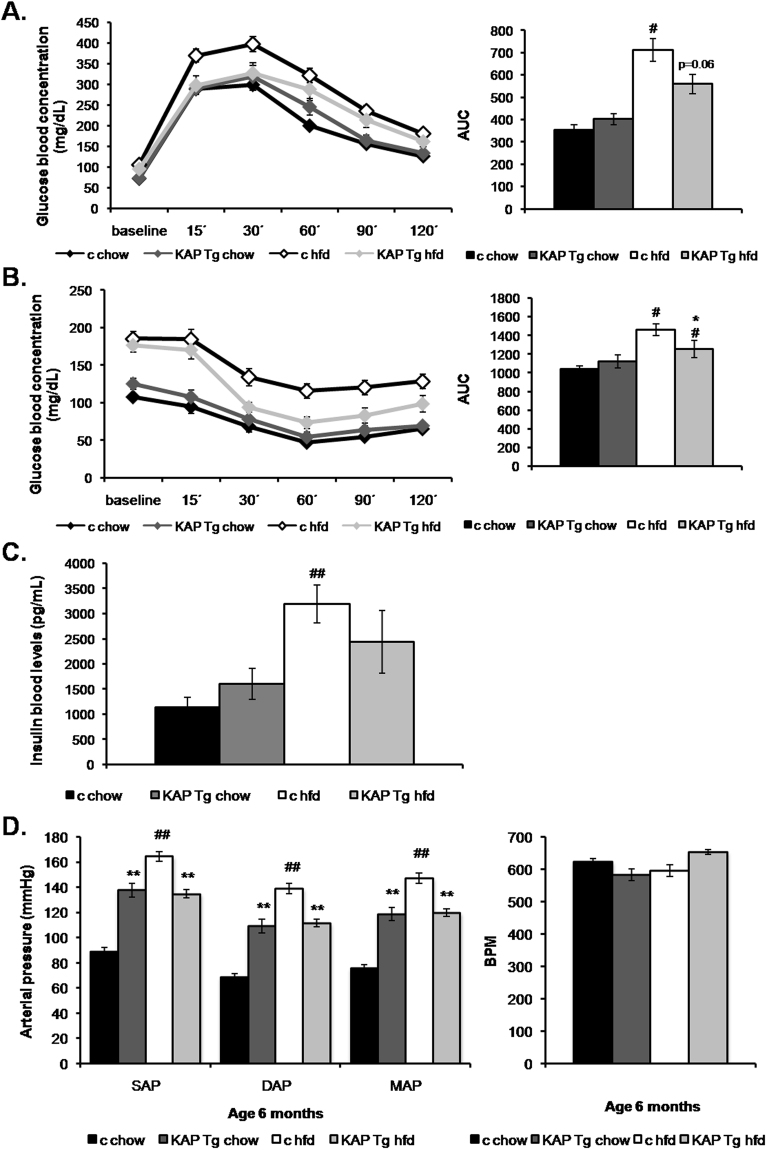
Figure 3.
Glucose metabolism and Hemodynamic analyses. Glucose metabolism assessment in Tg mice and control littermates fed on regular control diet or high fat diet, at 6 months of age. Results from three independent experiments, (n = 8 per group) are shown. (A) Glucose tolerance test (GTT) in awaken animals after 12 h o/n fasting. Results correspond to mean absolute values in basal conditions (pre glucose bolus) and at 15, 30, 60, 90 and 120 min after glucose bolus. Statistical analysis performed on area under the curve (AUC). ##p < 0.05 chow versus HFD. (B) Insulin tolerance test (ITT) in awaken animals after 5 h o/n fasting. Mean absolute values in same conditions as in A. Statistical analysis on AUC *p < 0.05 control vs Tg, #p < 0.05 chow vs HFD. (C) Insulin levels measured in 6-month old 5-h fasted mice, using the Mouse Serum Adipokine Milliplex kit. Two independent set of experiments (n = 8 per group). Blood samples were taken after 5-h over fasting. *p < 0.05 chow vs HFD. (D) Morning tail-cuff measurements of systolic (SAP) diastolic (DAP) and mean arterial pressure (MAP) in Tg and control littermate mice fed on standard control diet (chow) or high fat diet (HFD), at 6-month of age (left panel). Mean and SEM from one experiment (n = 8 per group) are represented. Statistical analysis on AUC **p < 0.01 control vs Tg, ##p < 0.01 chow vs HFD. Heart rate measurements in the four groups of mice (right panel). For all panels error bars correspond to SEM.

