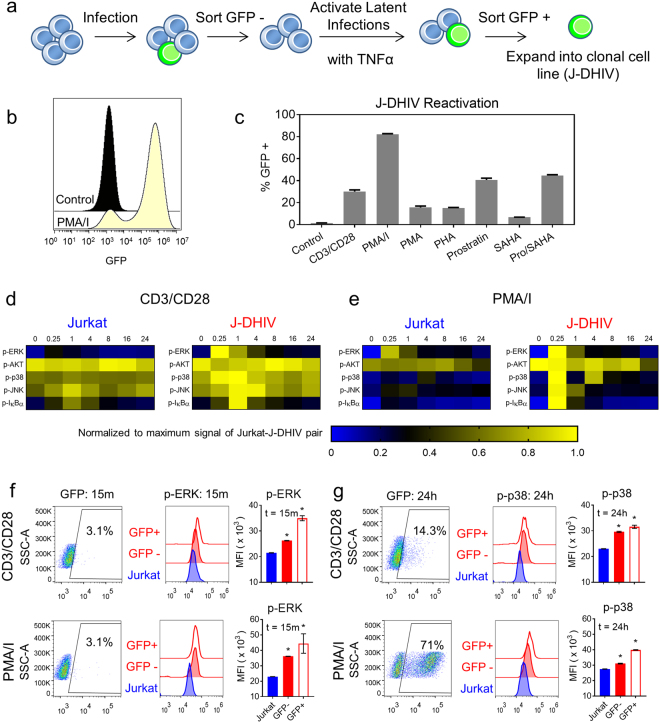
Figure 2.
Altered phosphorylation signatures observed in a latently infected Jurkat cell line model following T cell activation. (a) Schematic depicts the sorting strategy for generating a clonal DHIV-GFP/ HIV-1 LAI (X4)-infected Jurkat cell line (J-DHIV). (b) Histogram of GFP expression in the J-DHIV cells before (black) and after stimulation with PMA/I (yellow) measured by flow cytometry. (c) Viral reactivation levels after 24 hours of stimulation across a panel of LRAs. Data presented as means ± SD for 3 biological replicates. (d,e) Heatmaps depict phospho-protein time courses following CD3/CD28 or PMA/I stimulation in Jurkat and J-DHIV cells over 24 hours measured by bead-based immunoassay. Phospho-signals were measured in biological triplicate and 90% of measurements had an SD < 14%. Data are normalized to the maximum signal for each paired stimulation time course (uninfected and infected cells). Raw data are provided in Supplementary Datasets S7–S8. (f–g) Flow cytometry analysis of p-ERK at 15 minutes (f) and p-p38 at 24 hours (g) in uninfected Jurkat, latently infected (GFP-) and infected/reactivating (GFP+) J-DHIV cells following CD3/CD28 (top) or PMA/I stimulation (bottom). Gating for p24 (left plots) and histogram intensities for each population (middle plots) are shown. MFI of phospho-protein levels (right plots) presented as means ± SD for 3 biological replicates.

