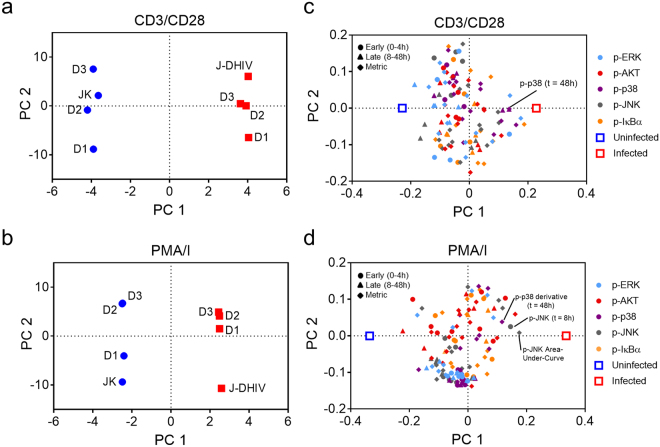
Figure 3.
PLS-DA model of dynamic phosphorylation signatures classifies uninfected and infected T cells. PLS-DA models comprising three principal components were calculated from phospho-protein time courses for uninfected and latently infected T cells treated with CD3/CD28 (R2X = 0.95, R2Y = 0.99, Q2 = 0.61) or PMA/I (R2X = 0.93, R2Y = 0.99, Q2 = 0.80) (a,b) Model scores projected onto PC1 versus PC2 for uninfected (blue) and infected (red) cells for both primary TCM cells from three donors (D1, D2, D3), and Jurkat (JK)/J-DHIV cell lines treated with CD3/CD28 (a) or PMA/I (b). (c,d) Model loadings of phospho-proteins and host-cell classification (uninfected, blue square; infected, red square) projected onto PC1 versus PC2 for CD3/CD28 treatment (c) or PMA/I treatment (d). Early time points (0–4 hours), circles; late time points (8–48 hours), triangles; time-dependent metrics, filled squares. Color codes of signaling pathways labeled on graph.

