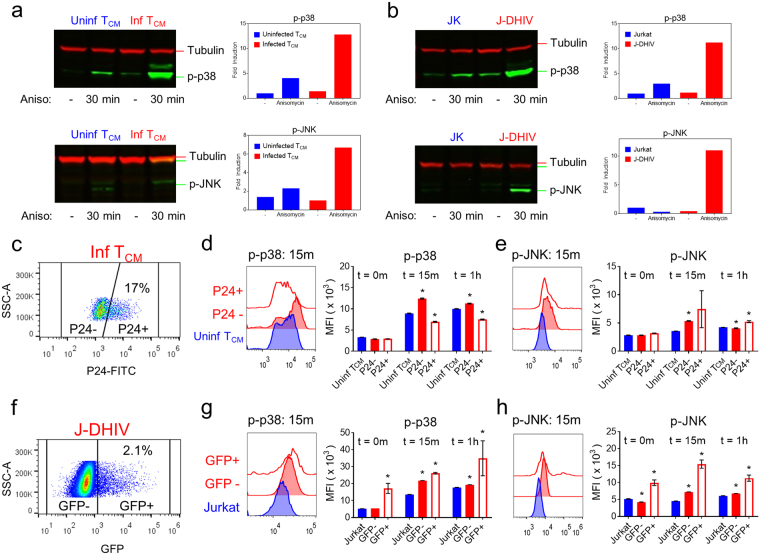
Figure 5.
Latently infected cells exhibit increased p38 and JNK stress kinase signaling in response to anisomycin. (a,b) Western blots for p-p38 (top) and p-JNK (bottom) expression46 with and without anisomycin treatment (30 minutes) in uninfected (left) and infected (right) primary TCM cells (a), and Jurkat (JK, left) /J-DHIV cells (right) (b). Mean intensities were normalized to the alpha-Tubulin loading control47 and fold increase in mean intensity was quantified (right plot). Cropped images shown here, full-length blots are presented in Supplementary Fig. S6. (c–h) Flow cytometry analysis of virus expression (c), p-p38 (d) and p-JNK (e) levels. (c) Gating for p24 and (d,e) histogram intensities (left plot) is shown for primary TCM cells. MFI of phospho-protein levels at 0 m, 15 m, and 1 hour following stimulation with anisomycin for uninfected (blue), latent p24− (red-filled) and p24+ (red-open) primary TCM cells is presented as means ± SD for 3 donors. (f) Gating for GFP and (g,h) histogram intensities (left plot) is shown for Jurkat/J-DHIV cells. MFI of phospho-protein levels at 0 m, 15 m, and 1 hour following stimulation with anisomycin for uninfected Jurkat (blue), latent GFP- (red-filled) and GFP+ (red-open) J-DHIV cells is presented as means ± SD for 3 biological replicates.

