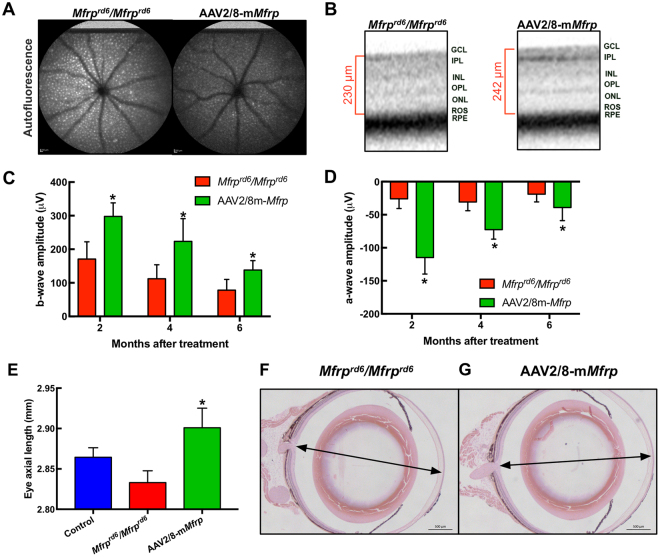
Figure 2.
Retinal function and axial length recovery after AAV2/8-mMfrp transduction. (A) Fundus autofluorescence (AF) of Mfrp rd6 /Mfrp rd6 versus AAV2/8-mMfrp treated eye. A fluorescence standard (an intensity comparison) appears as a bright strip at the top of each image. The AAV2/8-mMfrp eye fluoresced with reduced AF intensity. (B) SD-OCT suggests rescue of retinal cell layers. Representative SD-OCT image shows cell layer thickness was 230 µm in the untreated eye and 242 µm in the treated eye. (C) Quantification of ERG b-wave amplitude shows a significant increase in retinal bipolar cell activity 2-months following gene therapy. Data were analyzed with a pairwise Student’s t-test (p = 0.04). (D) Quantification of ERG a-wave amplitude showing significant increase in photoreceptor cell function 2-months following gene therapy (p = 0.004). (E) Eye axial length was measured using the 50 MHz ultrasound bio-microscope (UBM) probe on an AVISO A/B (Quantel Medical) and reported in millimeters (8 eyes per group). Data were analyzed using 1-way ANOVA followed by Tukey’s multiple comparison test. AAV2/8-mMfrp mice had a significant increase (average of 0.1 mm) in axial length compared to Mfrp rd6 /Mfrp rd6 mice (p = 0.0334). Histological comparison of Mfrp rd6 /Mfrp rd6 (F) and AAV2/8-mMfrp mice (G) eye axial length.

