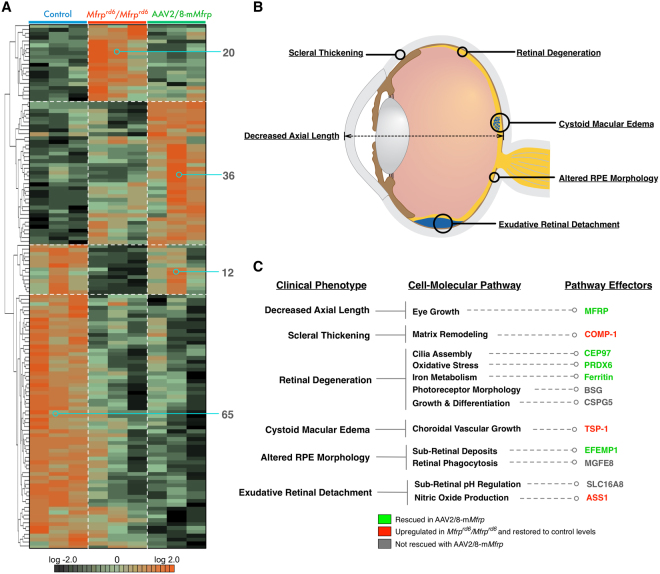
Figure 3.
Proteomic analysis of Mfrp rd6 /Mfrp rd6 and AAV2/8-mMfrp RPE reveal differentially-expressed proteins. (A) Hierarchal clustering of proteins differentially-expressed in Mfrp rd6 /Mfrp rd6 and AAV2/8-mMfrp mice compared to B6 controls. Results are represented as a heatmap and display protein levels on a logarithmic scale. A total of 137 proteins were differentially-expressed among the 3 groups (p < 0.05). (B) Pathogenic features of nanophthalmos. Illustration provided by Lucy Evans (acknowledgements section). (C) Correlations between pathogenic features of high hyperopia and the molecular pathways identified in our proteomic analysis.

