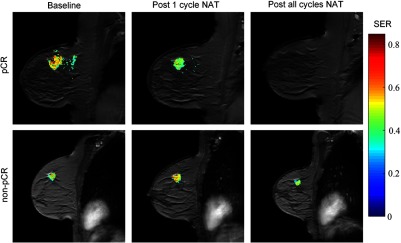
Fig. 1.
An example of semiquantitative DCE-MRI of a patient achieving pCR (top row) and a patient not achieving pCR (bottom row) before (first column), after the first cycle (second column), and at conclusion of all NAT (third column). The signal enhancement ratio (SER) overlaid on a high resolution anatomical MRI scan is shown. The high intensity regions-of-interest indicate gross tumor burden. The patient who ultimately achieved pCR demonstrates reduced tumor burden after one cycle of NAT.

